Color scale in "Sentinel Hub Playground" images

Hello everybody

I’m currently using “Sentinel Hub Playground” (I plan also to move to the EO-browser soon, although I have still some problems with this - depending probably on my PC browser).

Now, what is a bit problematic with Playground, is that most of the available renderings (like “Color Infrared”, “Vegetation index” or “Moisture index”) cannot be easily understood because of the absence of a colorbar showing the color scale and the corresponding values.
For example, what is color associated to the highest moisture index, dark blue or light blue or something else? This is not easy to figure out since no information is given on that.
Apart from “Natural color” rendering, obviously , all the others renderings suffer more or less from this issue.

Another point (maybe trivial for you) but that it is not entirely clear to me is the the following: is the color scale always the same (for example: does the same color correspond to the same Moisture index value, in all the the maps, at any time and in any place, or there is some kind of normalisation in every map/tile, so that the same color corresponds to a value depending on the map?)
This should be clear if you could provide some color bar associated to the map, by the way.

So, is it possible to show the color scale (with the corresponding numerical values) on the Playground rendering itself? Or, if it is not, where can I find at least a reference color scale?
Is this problem bypassed or fixed by using your “EO-browser”?

Thank you in advance and best regards!

Hello Nicola,

Playground currently doesn’t support legends and we are unable to promise if and when they will be added. That said, EO Browser does support them, and it should be very similar to Playground in its core functionality (it has many other features, but you can ignore those until you need them).

Could you share the problems you are having with EO Browser so we can advise on how to solve them?

Kind regards,

Anze @ Sinergise

Dear Anze
many thanks first.

“Playground currently doesn’t support legends”-> ok, I understand…
What can you tell me about my second question, please, i.e wheter the colors in all the maps are univocal, regardless of the time and of the place (so that different Playground images can be straightforwardly “compared”)?
Sorry if it is a silly question or if even it doesn’t make any sense, I don’t know how you create these images, so in principle I cannot know how it works.

“Could you share the problems you are having with EO Browser” → I’m using Safari 9.1.1 on MacOSX10.11, so I’m not realli up-to date, it’s probably my fault on this… I’ll try to download some newer browser, like Opera or Chrome (do you have any other suggestion?).
Anyway, what I do now is just to go to:

then I leave the dafault values (even with the map centered around Rome), I click on “Search” button and everything disappears!!!
I have the last version of java installed and everything enabled, so I think it is just an issue of Safari…

Best regards
Nicola

Let me try to answer some of your questions:
Satellite imagery is a bit tricky - the sensors on the satellite are generally calibrated pretty well, so the same “situation” should result in the same value (reflectance). However, there is atmosphere in a way and this is changing - clouds, fog, thickness of the atmosphere, angle of the sun, etc. All of these affect the values. The atmospherically corrected data should improve this to some extent, so I recommend you use “L2A” type of the data (there is an option for this in EO Browser). However, this is still approximation so some changes remain.

I recommend using Chrome, it will probably work best.

Hi Grega.
Thank you for your comments about the calibrations and for your suggestion concerning the browser.
Chrome works really well together with EO Browser, I have just started practising with the different options and with the available representations and so on…
Now I’m back to my first question - how can I get a colorbar or any useful information about the color scale for all-except-for-the-true-color images?

You will find the legend by expanding the layer name, see the image below.
Legend is only available where we found reasonable information behind, e.g. NDVI, scene classification (with L2A), Sentinel-5P values, etc. Many EO products are not that straightforward to “interpret”. You will probably have to study the details of each of these indices.

I suggest checking:

https://www.indexdatabase.de/

Once you get familiar with the data and indices, you can create your own layers and define the legend however it fits you:

Hello, I have the same question as Nicolas: I want to get the meaning of the colors, so a colorbar (for vegetation index and moisture). I can’t expand the layer name, or even any layer name, is it normal?

Thank you!

Nicolas is using EO Browser, which has more information:

Hi everyone,

We run a Digital Farm

Also, I wanted to ask you for a favor if you may?

I want you to provide me with more details (Tutorial Videos, Guide of use…etc) about the " Vegetation index " of Sentinel Playground App addressing:

Q1- What’s the difference between VI in Sentinel Playground App and NDVI in EO Browser knowing that they have the same Formula?

Q2- How to read them professionally?

Q3- What do the following colors represent in the " VI " :

Yellow =…?

Dark Yellow (RGB: 191, 144, 0) = …?

Light Turquoise = …?

Blue = …?

Dark Blue (RGB: 5, 77, 99) = …?

Thank you.

1 Like

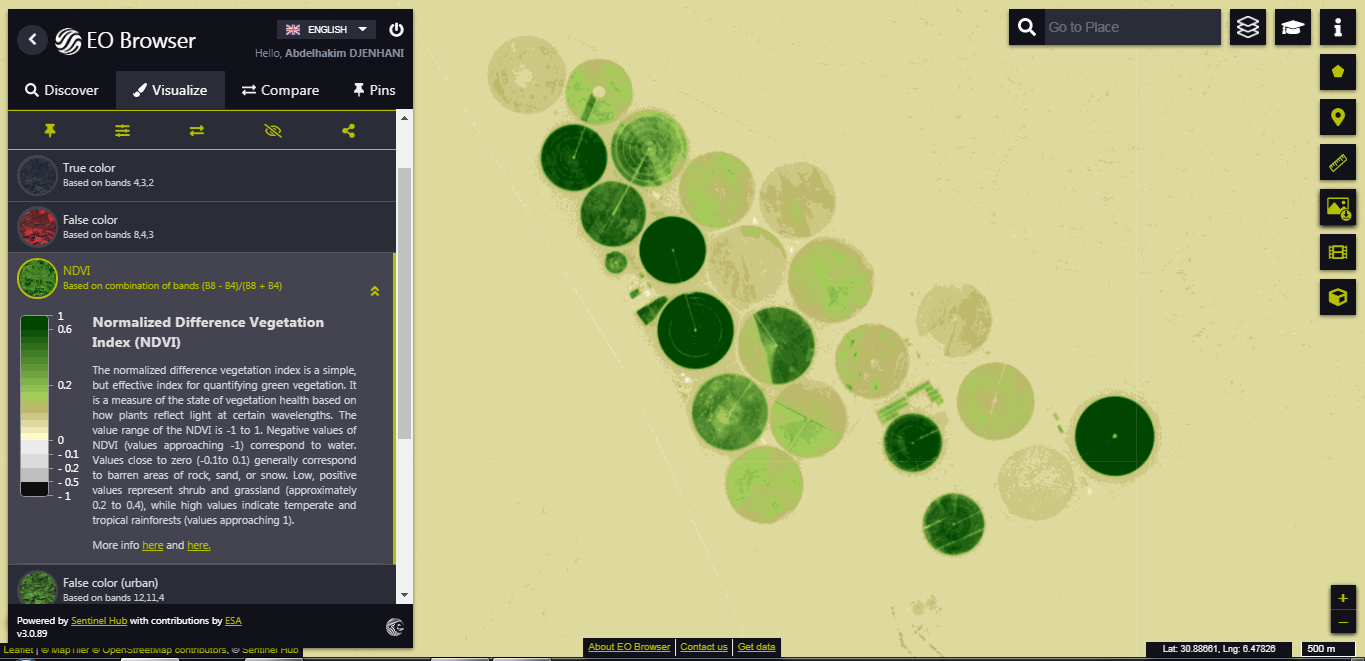
Check out the NDVI scripts on the custom script repository. There are 3 different visualizations available - the second one is used in Sentinel Playground, and the third one in EO Browser.

In the visualization you can see which color corresponds to which value of the NDVI.
So for Sentinel Playground you have the following script:

let ndvi = (B08 - B04) / (B08 + B04);

if (ndvi<-0.2) return [0,0,0];
else if (ndvi<-0.1) return [1,0,0];
else if (ndvi<0) return [0.6,0.0,0,0];
else if (ndvi<0.1) return [0.4,0,0];
else if (ndvi<0.2) return [1,1,0.2];
else if (ndvi<0.3) return [0.8,0.8,0.2];
else if (ndvi<0.4) return [0.4,0.4,0];
else if (ndvi<0.5) return [0.2,1,1];
else if (ndvi<0.6) return [0.2,0.8,0.8];
else if (ndvi<0.7) return [0,0.4,0.4];
else if (ndvi<0.8) return [0.2,1,0.2];
else if (ndvi<0.9) return [0.2,0.8,0.2];
else return [0,0.4,0];

You can see that color [0,0,0] (which corresponds to black) is used for all pixels with NDVI value below -0.2, red color [1,0,0] is used for all the pixels with values between -0.2 and -0.1, and so on.

The EO Browser visualization is the following one:

let ndvi = (B08 - B04) / (B08 + B04);

if (ndvi<-0.5) return [0,0,0];
else if (ndvi<-0.2) return [0.75,0.75,0.75];
else if (ndvi<-0.1) return [0.86,0.86,0.86];
else if (ndvi<0) return [1,1,0.88];
else if (ndvi<0.025) return [1,0.98,0.8];
else if (ndvi<0.05) return [0.93,0.91,0.71];
else if (ndvi<0.075) return [0.87,0.85,0.61];
else if (ndvi<0.1) return [0.8,0.78,0.51];
else if (ndvi<0.125) return [0.74,0.72,0.42];
else if (ndvi<0.15) return [0.69,0.76,0.38];
else if (ndvi<0.175) return [0.64,0.8,0.35];
else if (ndvi<0.2) return [0.57,0.75,0.32];
else if (ndvi<0.25) return [0.5,0.7,0.28];
else if (ndvi<0.3) return [0.44,0.64,0.25];
else if (ndvi<0.35) return [0.38,0.59,0.21];
else if (ndvi<0.4) return [0.31,0.54,0.18];
else if (ndvi<0.45) return [0.25,0.49,0.14];
else if (ndvi<0.5) return [0.19,0.43,0.11];
else if (ndvi<0.55) return [0.13,0.38,0.07];
else if (ndvi<0.6) return [0.06,0.33,0.04];
else return [0,0.27,0];

It is very similar, with values slightly different and a different color scheme.
To learn how to map these numbers to RGB values and how to construct classified visualizations like this, you can check our custom scripts webinar here and a beginners tutorial (a prerequisite for the webinar), which also explains the continuous visualization, here.

The question of how to visualize data best is a complex question. You can always just return a grayscale visualization, and then you can even tweak it in EO Browser effects, to give it a green tint. This result is continuous and least modified. You can also do this using our index tool and choose one of the color gradients, or use a visualizer, where you can choose any color gradient you want.

let ndvi = (B08 - B04) / (B08 + B04);
return [ndvi]

However, as soon as you decide to implement discrete visualization or a continuous visualization based on custom increments, as we’re doing here, you have to decide what fits best. This is a complex topic. You would usually want to visualize an index based on where most data is located - if most data is between 0 and 0.2 for example, you would want more increments there (e.g. -1, 0, 0.05, 0.1, 0.15, 0.2, 0.5, 1). This can be best checked by observing the histogram of your area to learn about the distribution of values. When making global visualizations, it becomes even more complex, as the value distribution for one area can differ greatly from the other. Then it’s all about choosing some kind of compromise, or to choose a more objective method of for example returning equal increments, and taking into account that the visualization will be worse off in some areas. It’s all about observing what works best - you can easily change the increments and colors and get a bit different result, but you’re always striving to keep as much value difference as possible, while still keeping a readable map (e.g. having 200 different colours, each for its own value, wouldn’t make sense). For NDVI, we find that following a distribution like these scripts works well globally.

Dear Monja Sebela
You can’t imagine how much I’m grateful to you. YOur reply with that many details provided helped me a lot and I mean A LOT! THANK YOU SO MUCH!
I mean, I was struggling to understand how reading works without having any clue about Indexes, But now with your help, the sunrise shines, I even start customizing the colors according to my needs! and that was so cool.


THANK YOU SO MUCH I DO REALLY MEANT IT!
Another special THANKs to Ms.Sabina for the professional work she’s providing, and for Mr. Marco as well for his comments and tips.
Sorry for this late reply, All the best to you all.
Stay Safe & Stay awesome, Bye.

2 Likes