I am new to the EO community. It’s great to see a well-maintained and popular forum for Sentinel Hub. I have a question about Sentinel-2 data (L2A) products, specifically calculated vegetation indices.
From my Configuration Utility I have created new configuration for available data L2A (ID e814485d-2d6f-MASKED). Then I have prepared data with no clouds from whole possible terms.
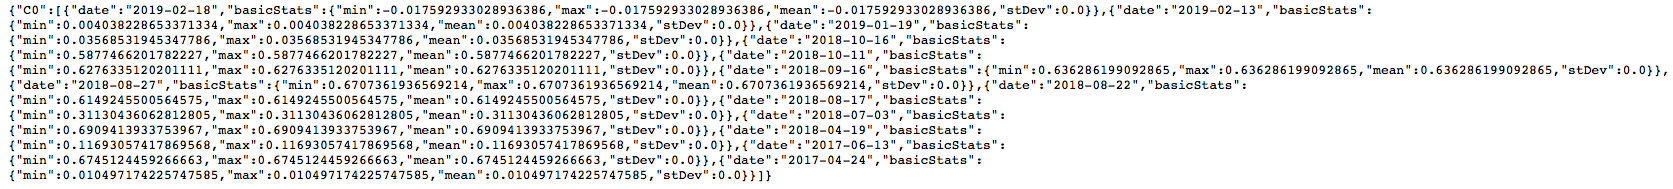
But there has to be a problem with generating the values, because the dates are not corresponding, st. deviation are zeros (and also min/max) and means of vegetation indices (NDVI and Moisture Index) are different from the EO browser app if I manually select the same area.
Note that L2A data are available in Europe since March 2017 in Europe and December 2018 globally.
the layer you are using for FIS is configured as visualization layer, which means that you are getting values of red/green/blue bands rather than vegetation index.
Looking at the results of the request, results only available since December 2018, I feel that your coordinates are wrong, that you are looking at area outside Europe. So probably lat and lon are switched?
Dear Grega, Thank you for your reply, anyway, there is still mistake, look at the values of Vegetation Index and also on mix/max/st. deviation. This is not corresponding with the values in EO Browser (and you can not get st. dev. all zeros). I have tried your URL here:
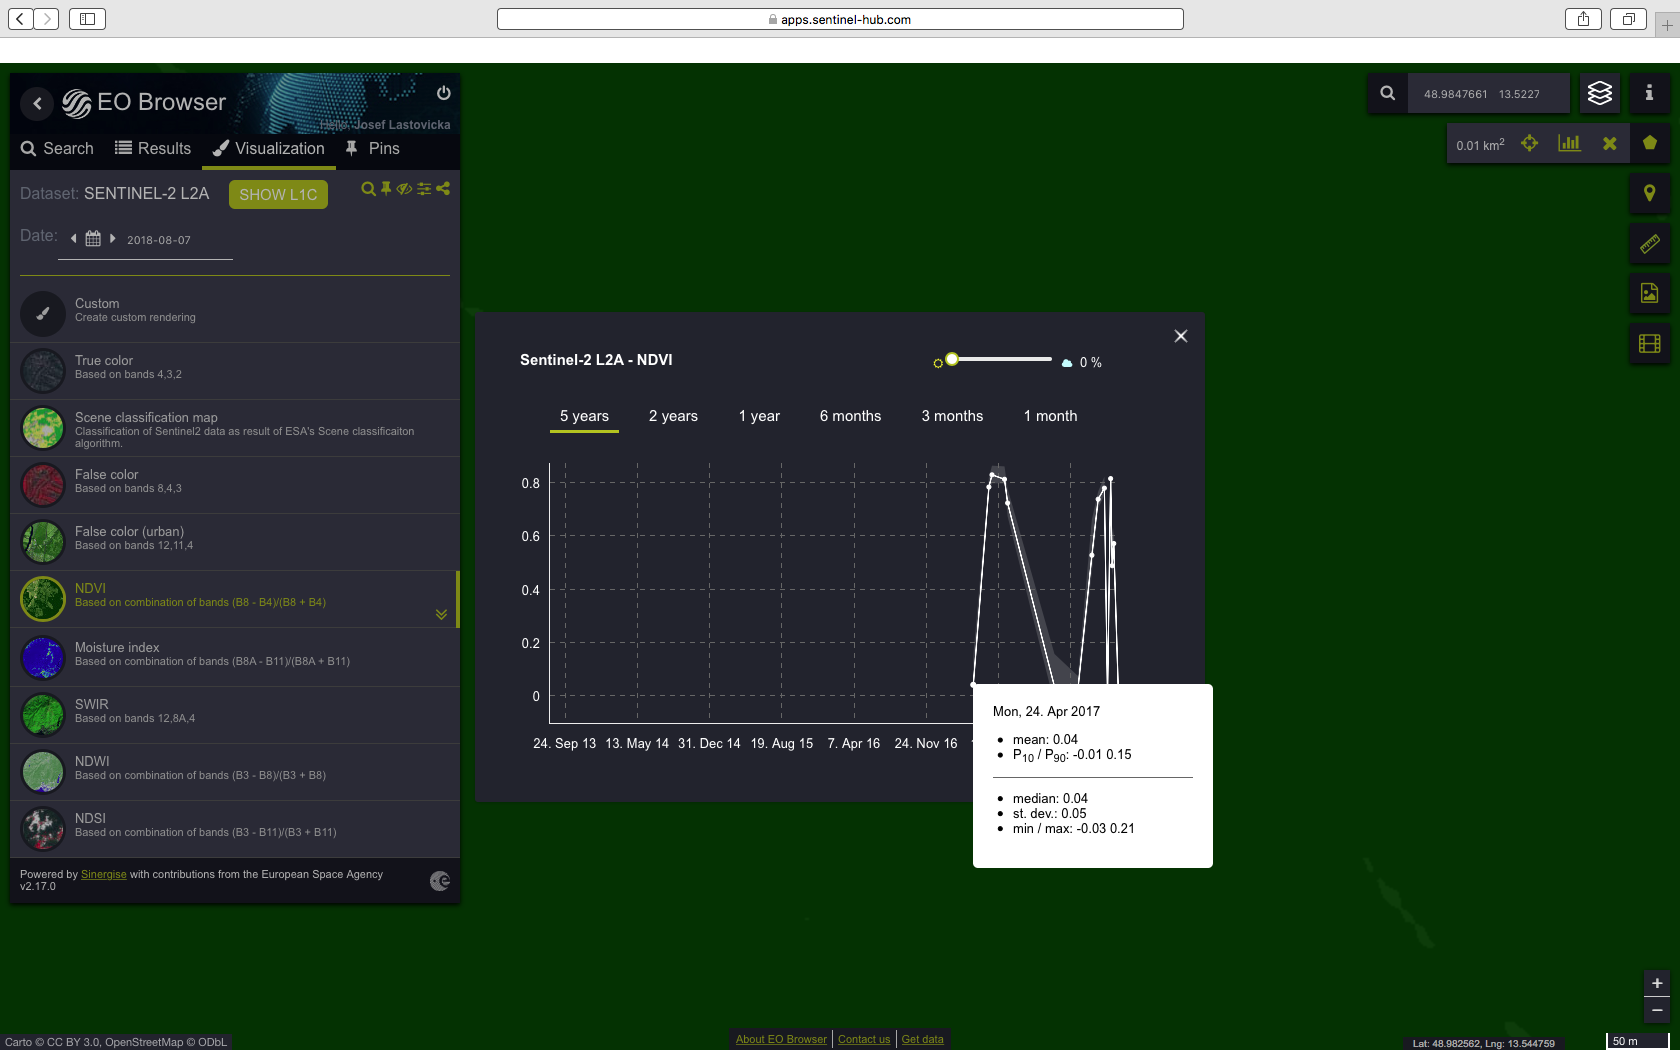
And this is what I get from the EO for the same area (there is different mean/min/max values). And also, if you select 0 % clouds in EO and in URL (MAXCC=0), you get different number of scenes.
Dear Grega, sorry, my mistake, the values of mean are corresponding. But If I use URL, for all values (MIN=MAX=MEAN) I get only NDVI mean from the area Please, can you prepare for me the same layer for Moisture Index (not values for visualization of the layer, but the values of the Moisture Index) as you prepared for NDVI in my Configuration Utility? Thanks a lot! Josef
the first four lines are actual calculation of the index, the rest is for visualization.
So in your case the script would be:
if (B8A == 0 || B11 == 0){
return [0];
} else {
var val = (B8A - B11)/(B8A + B11);
return [val];

 Please, can you prepare for me the same layer for Moisture Index (not values for visualization of the layer, but the values of the Moisture Index) as you prepared for NDVI in my Configuration Utility? Thanks a lot! Josef