Hey together,
I’ve downloaded a timeline of images for a given BBox (via a list of SentinelHubRequests and the SentinelHubDownloadClient). In total ~200 images. After plotting I realized that each other image is shifted by 1 pixel (mostly in y direction) and I don’t have a good explanation why that should be. It is not easy to see when simply plotting the images. → Is there a way to add a video to let u see my point?
Two images to show the difference (most clear at the top):
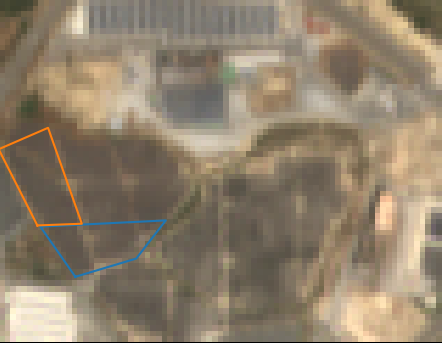
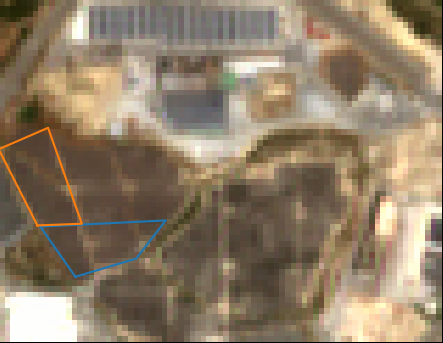
Here the data for the doawnload:
BBox = [34.739049986188, 36.8878178602676, 34.7479843718134, 36.8932134384373]
time  = '2018-07-01', '2021-09-30'
resolution = 10
The images have the size of 61x79 pixel.
Thank you for your help.