Dear @dthiex ,
Your reaction is just not enough information what I currently need. Let me summarize what I need to do:
In my project I have data containing information of a certain pieces of ground. The most important information is the reflectance data of every wavelengths (with steps of 0.5 nm) between 400-2300. My job is to get, with current time data, the wavelengths of a certain piece of ground/place chosen on the world map, to eventually compare it with my project data and use the wavelengths to recognize certain materials (Like carbon) and use it to calculate SOC (https://www.agric.wa.gov.au/measuring-and-assessing-soils/what-soil-organic-carbon)
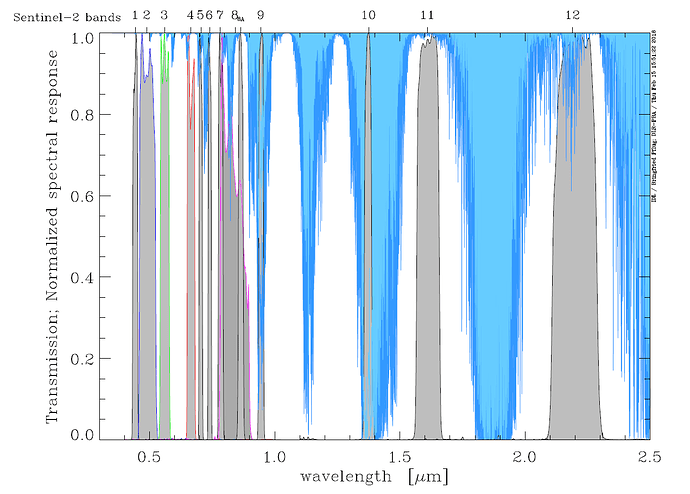
The technical guide that you send does come closely to the answer, but it doesn’t show how you can create a script to get the precise values. The following image:
shows the places where the bands get their piece of data. But I need to get it from almost every wavelength (hopefully steps of 0.5) and then their transmission/reflectance. E.g.: Input: 1534.5 nm → Output: 0.23 transmission. Or a graph like the picture above show for a lot more wavelengths than the band show.I don’t really understand the capabilities of the MSI what the Guide is showing, but picture does proof that it does use precise inputs to get the output. The guide doesn’t really show how to get this picture. So my question summarized is: How can I get Sentinel 2 data to show me a certain piece of ground, the output of all wavelengths between 400-2300. If this isn’t possible for sentinel 2, please let me know.
Best,
@rubenski0345
