Hi,
When I search for Sentinel2 images (L2A product, i.e., surface reflectance) I cannot see the QA band (classification band) that usually comes with the L2A images.
How can I get this band so I can overlay it for visualization?
Thanks,
Ran
Hi,
When I search for Sentinel2 images (L2A product, i.e., surface reflectance) I cannot see the QA band (classification band) that usually comes with the L2A images.
How can I get this band so I can overlay it for visualization?
Thanks,
Ran
Check this post
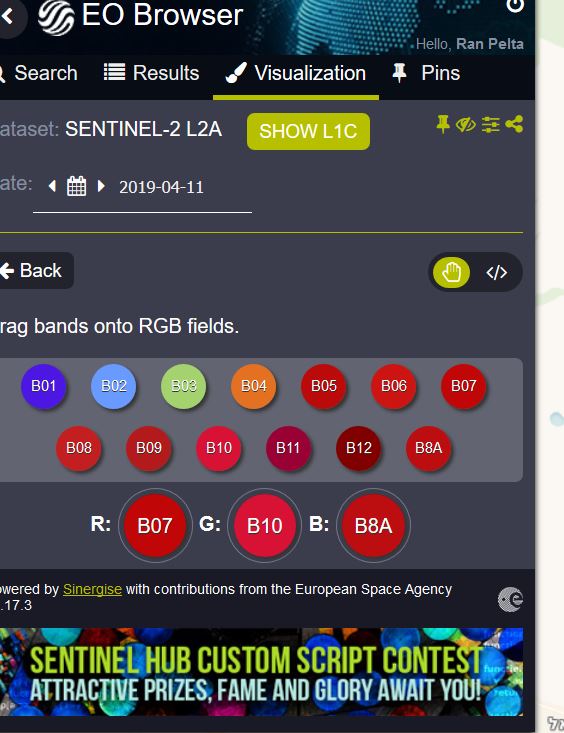
Hi, thanks, but I’m not sure I understand… I meant- how do I visualize the SCL layer in the UI.
I’m attaching UI menu for visualization which does not contain the SCL option.
Is there a was to visualize the SCL band? and of course to know the value of a selected pixel?
If you click the yellow switch on the top right part of the screenshot, you can enter the Custom script as presented in the forim thread.
There is no user interface for that
oh, now I see, thanks