I feel your pain Please find below my attempts to answer your questions.
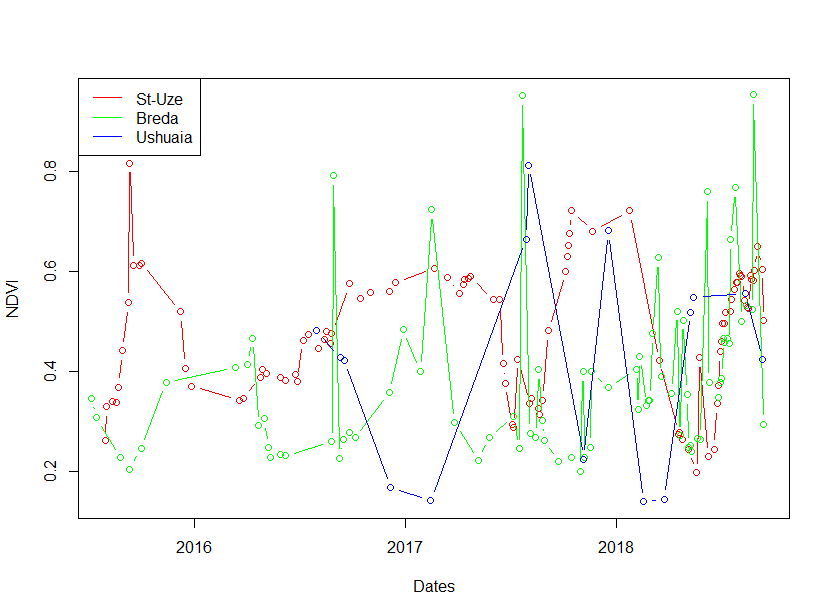
Why is the historical NDVI not available before 2016?
Is this a typo? Did You mean before 2015, because the plot shows data before 2016. Anyway, to answer this question properly I would need to know which satellite data are you using: Sentinel-2, Landsat-8, …? If Sentinel-2, then https://www.sentinel-hub.com/develop/documentation/data_sources exaplains why. TL;DR The first out of two Sentinel-2 satellites (Sentinel-2A) was launched in June 2015.
Why are available data not regular but seem to be randomly distributed in time?
Excellent question, but difficult to answer. The frequency of available products (images) depends on many factor, such as:
latitude (revisit time of a point close to poles is much shorter than of a point at equator). See for example this paper
cloud coverage: I’m not sure if you have a threshold on max cloud coverage in your request set. But if you do, then this can throw away acquisitions that are too cloudy (which you should do). Since cloud coverage depends on your region of interest (i.e. there are less clouds in Sahara than in tropical forest near equator) and season (dry season vs. wet).
other factors, that I may have missed.
Why do those characteristics (historical depths and distribution of date availability) change completely from one place to another ?
Perhaps the part of the answer to this question is already given above. Cloud coverage depends on region of interest and seasonality. The min/max NDVI value depends on type of vegetation in some extent: is at minimum the land still covered with some vegetation, or is the land completely dry.
Indeed, I have found the “MAXCC” parameter, and by modifying this I can have more or less points. I do not know what the default value is (the documentation say 100, but obviously this is not the case). Anyway, this part of the problem is solve. Thank you again.
Regarding the satellite I use, I do not have any idea. How can I know it ? How can I change it ? I have not found any parameter like that in the documentation.
Just after putting my last reply, I discovered what you explain and how to change satellite.
This is why I deleted my post, without knowing that you where answering.
Anyway thank you very much for your help.
 Please find below my attempts to answer your questions.