I’m looking around in EOBrowser and i am looking for an answer to the question of how to include% cloudiness in the created time series from one spectral channel. This function is available when selecting a predefined layer, eg NDVI, then in the graph window we have a slider that allows filtering the cloud cover. I would like to achieve a similar effect by analyzing a single channel, eg B04. I return such a layer with a short script return [B04], but in the window when generating the time series, there is no slider with% cloudiness. Is there any way to be able to manipulate the cloud cover in this case? I also wonder what the y axis represents when analyzing a single channel. I conclude that this is the rebound value (just why do values higher than 1 appear - how to explain this). Is there any way to get to the raw data, which stores a DN (Digital Number) in a pixel unprocessed into a reflection value? I have attached two screenshots below to illustrate the situation: NDVI analysis and B04 analysis.
The reason the slider isn’t available for your custom script whereas it is for a defautl layer (e.g. NDVI) is because the system is configured slightly differently in the background. However, you can change your Evalscript to mimic the behaviour of the default service.
The last layer returned in the Evalscript is considered to be the cloud mask by the statistical tool. The tool will count the pixels that are cloudy (1) or not (0) in the last band to offer the functionality of having a slider that allows filtering the cloud cover. In your case, you could do the following:
//VERSION=3
function setup() {
  return {
    input: ["B04", "SCL"], // Band 4 and the Scene classification data, based on Sen2Cor processor, codelist
    output: { bands: 2 }
  };
}


function isCloud (scl) {
  // Compute clouds based on SCL layer
  if (scl == 3) { // SC_CLOUD_SHADOW
    return false;
  } else if (scl == 9) { // SC_CLOUD_HIGH_PROBA
    return true;
  } else if (scl == 8) { // SC_CLOUD_MEDIUM_PROBA
    return true;
  } else if (scl == 7) { // SC_CLOUD_LOW_PROBA
    return false;
  } else if (scl == 10) { // SC_THIN_CIRRUS
    return true;
  } else if (scl == 11) { // SC_SNOW_ICE
    return false;
  } else if (scl == 1) { // SC_SATURATED_DEFECTIVE
    return false;
  } else if (scl == 2) { // SC_DARK_FEATURE_SHADOW
     return false;
  }
  return false;
}


function evaluatePixel(sample) {
 var cloud = isCloud(sample.SCL);
 return [sample.B04, cloud];
}
With the Evalscript above, you will then have the statistical tool with the the cloud cover slider.
However, you will quickly notice that the display service will also interpret the last band as a transparency layer and will only display cloudy pixels . If you can live with that and just need access to the stats, I would stop here. If you need a visualisation and the statistics, keep reading…
To have a nice visualisation and at the same time have the statistical features with your layer in EO Browser, I would recommend you create your own layers in a custom configuration. You can find how to do this in our FAQ. Once you have your layers set (they can be as simple as returning B04), you can then set up the system to compute statistics whilst taking in account cloud cover. There is a whole section on this in the FAQ also.
If you try this approach and get stuck don’t hesitate to post here!
your answer is really very helpful and on point, thank you very much.
Having statistics, no visualization - that’s enough for me at the moment. Now statistics are crucial for me.
Do you know what it is like with the values displayed on the y axis? I was working locally on Sentinel-2 data and the pixel values for each channel were in the order of 1000. I understand that the data shared on the portal is already converted to the reflection value, which should be 0-1, and the peaks visible in the graph up to 1.2 and more are caused by clouds? Is that where these values over 1 come from?
Indeed, the values returned are in reflectance (DN/10000). Values above 1 are physically possible, sometimes related to clouds but not only. I wrote a brief note about this a while back: L2A images to range 0 to 1 - #4 by maxim.lamare
I have one more question. Is it possible to access Sentinel-2 L1C level data using scripts from EOBrowser? Can I build a vegetation index or let’s say a time series for the selected spectral channel from L1C data that filters the search results based on the SCL layer from Sentinal2 L2A data? Thank you in advance for your answer.
Yes, you can work with Sentinel-2 L2A and L1C data using the data-fusion capabilities of Sentinel Hub services.
Here is an example in EO Browser which you can tweak to your liking: https://sentinelshare.page.link/dUpd
It calculates L1C NDVI only for areas where SCL (from L2A) is “vegetation”.
Thank you very much, your advice is realy helpful.
I combined 2 pices of code you paste here and I recived code like below:
function setup() {
  return {
    input: [
        {datasource: "l2a", bands:["SCL"]},
        {datasource: "l1c", bands:["B04"]}
    ],
    output: { bands: 2 },
    mosaicking: "SIMPLE"

  };
}

function isCloud (scl) {
  // Compute clouds based on SCL layer
  if (scl == 3) { // SC_CLOUD_SHADOW
    return true;
  } else if (scl == 9) { // SC_CLOUD_HIGH_PROBA
    return true;
  } else if (scl == 8) { // SC_CLOUD_MEDIUM_PROBA
    return false;
  } else if (scl == 7) { // SC_CLOUD_LOW_PROBA
    return false;
  } else if (scl == 10) { // SC_THIN_CIRRUS
    return false;
  } else if (scl == 11) { // SC_SNOW_ICE
    return false;
  } else if (scl == 1) { // SC_SATURATED_DEFECTIVE
    return true;
  } else if (scl == 2) { // SC_DARK_FEATURE_SHADOW
     return true;
  }
  return false;
}

function evaluatePixel(samples) {
  var s2l1c_samples = samples.l1c[0];
  var s2l2a_samples = samples.l2a[0];
  var cloud = isCloud(s2l2a_samples.SCL);
 return [s2l1c_samples.B04, cloud];
}
I think it works. As for the display of the data on the map, I expect that it is l1c data filtered by the SCL layer from l2a. However, when I try to do the time series for some polygon, I get “Error: Dataset with id: l2a not found.” Why is this tool trying to reference l2a data? Do you know how to fix it? I would like to have a time series from the S2L1C data for exactly the same imagery (acquisition times) as for S2L2A (using the SCL layer).
Your Evalscript looks ok, could you please post the payload of your request? It can be that sometimes the sen2cor processing fails on ESA’s side and the L2A scene is not available. To be sure I would like to check your AOI/dates etc…
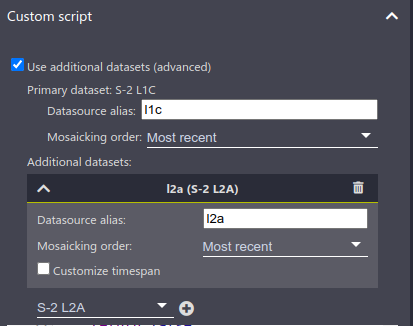
I understand the issue now… you need to select the Use additional datasets (advanced) button above your custom script to enable datafusion. Then you can select the input sensors you need (here S-2 L2A and S-2 L1C) and assign them the same names as in the setup function of your Evalscript:
Looking at the output, you might want to change
return [s2l1c_samples.B04, cloud];
to
return [s2l1c_samples.B04, !cloud];
if you want to mask the clouds (or change the isCloud function). Here you are masking everything outside the clouds.
In the isCloud function I assigned random values only for tests.
I selected additional dataset option, without that the script couldn’t see dataset as you write.
But the problem is with creating time series from l1c data (using filtering by SCL [isCloud function]).
The problem is here. like in the picture below:
Ultimately, I would like to have a graph of the reflection intensity versus time as before based on the l2a data. As for the l2a data, I would like to be able to determine the percentage of cloud cover (the slider in the upper right corner). If I understand the previous posts correctly, this slider is combined with the isCloud function in which I can determine, for example, what percentage of pixels in a given area are pixels classified as medium cloud probability if we take one class into account, or e.g. medium and high probability of clouds at the same time.
The statistical information tool is pre-configured for a certain number of “standard” layers in EO Browser.
EO Browser uses the older FIS service to produce the graphs, and this service does not support datafusion. This means that you can display the combined layers (as you have done) in EO Browser, but not extract statistics.
To obtain L1C data with L2A cloud filtering, you can use the replacement of FIS: the Statistical API. This API offer a lot of options in how you can return the data, and allows you to also use Python (see examples).
If you have difficulties with the Statistical API, don’t hesitate to ask in the forum.
I have one another question.
I’d like to know what is the resolution of the single bands I use to create time serie in the EOBrowser.
I know the specification of S2 data - is it the same in bands defined in EOBrowser?
For example: B04 - 10 m, B11 - 20 m, B01 - 60 m?
If I understand correctly, when I use the time series tool for some bands for some selected polygon, is the calculation done for the original source resolution? I mean the polygon has an intersection with a raster with the original resolution? This layers are not downsampled / upsampled for this purpose?
Actually, the “time series tool” which produces charts in EO Browser is based on the statistical API which returns statistics to the graph, with resolution depending on your zoom layer. Therefore if you are not zoomed in far enough in EO Browser, the statistics will be calculated on downsampled data.
The Statistical API uses a resolution that is calculated so that there are around 1000 pixels in the bounding box, so you may have to play around with the zoom levels a little to get what you need. A good way of seeing exactly the resolution of the request is to open the developer tools in your Browser and check the payload of the request that is being sent (in chrome it’s the network tab).

 . If you can live with that and just need access to the stats, I would stop here. If you need a visualisation and the statistics, keep reading…