10m pixels Moisture indexes

Hi! I’m really new to satellite imagery and I’ve been struggling to understand what is the right approach to define the size of each pixel.
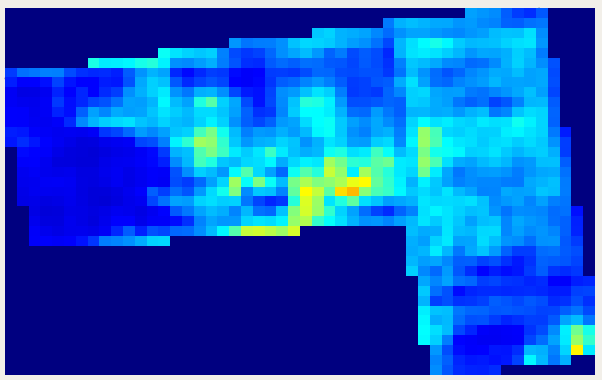
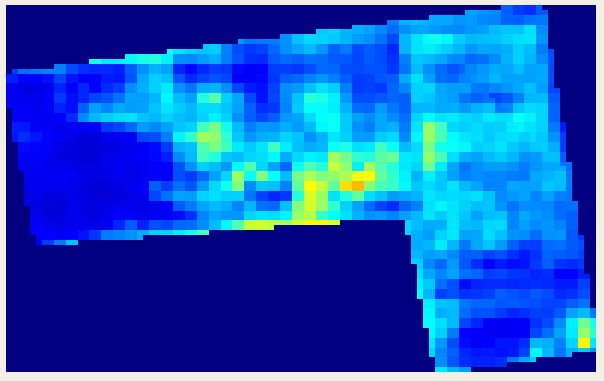
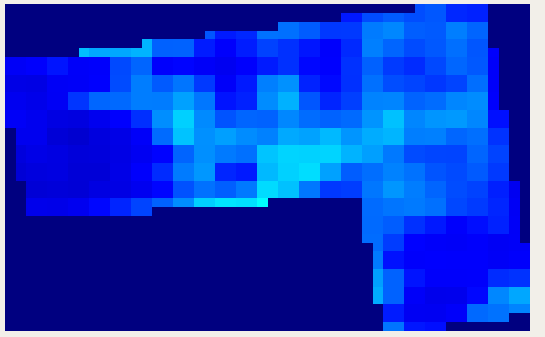
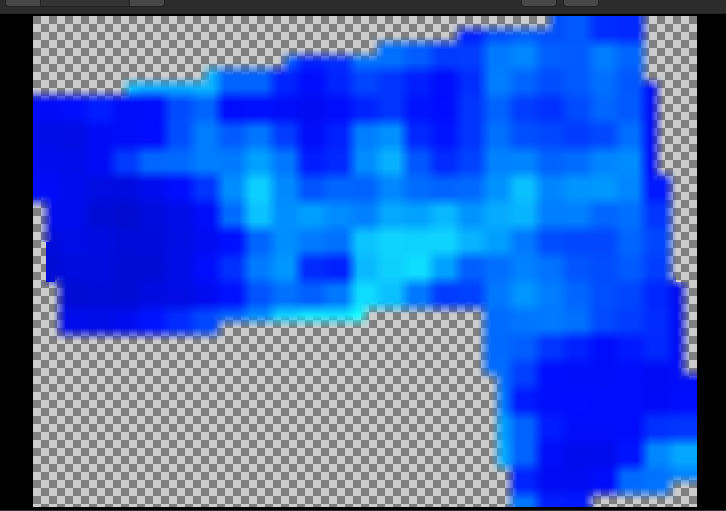
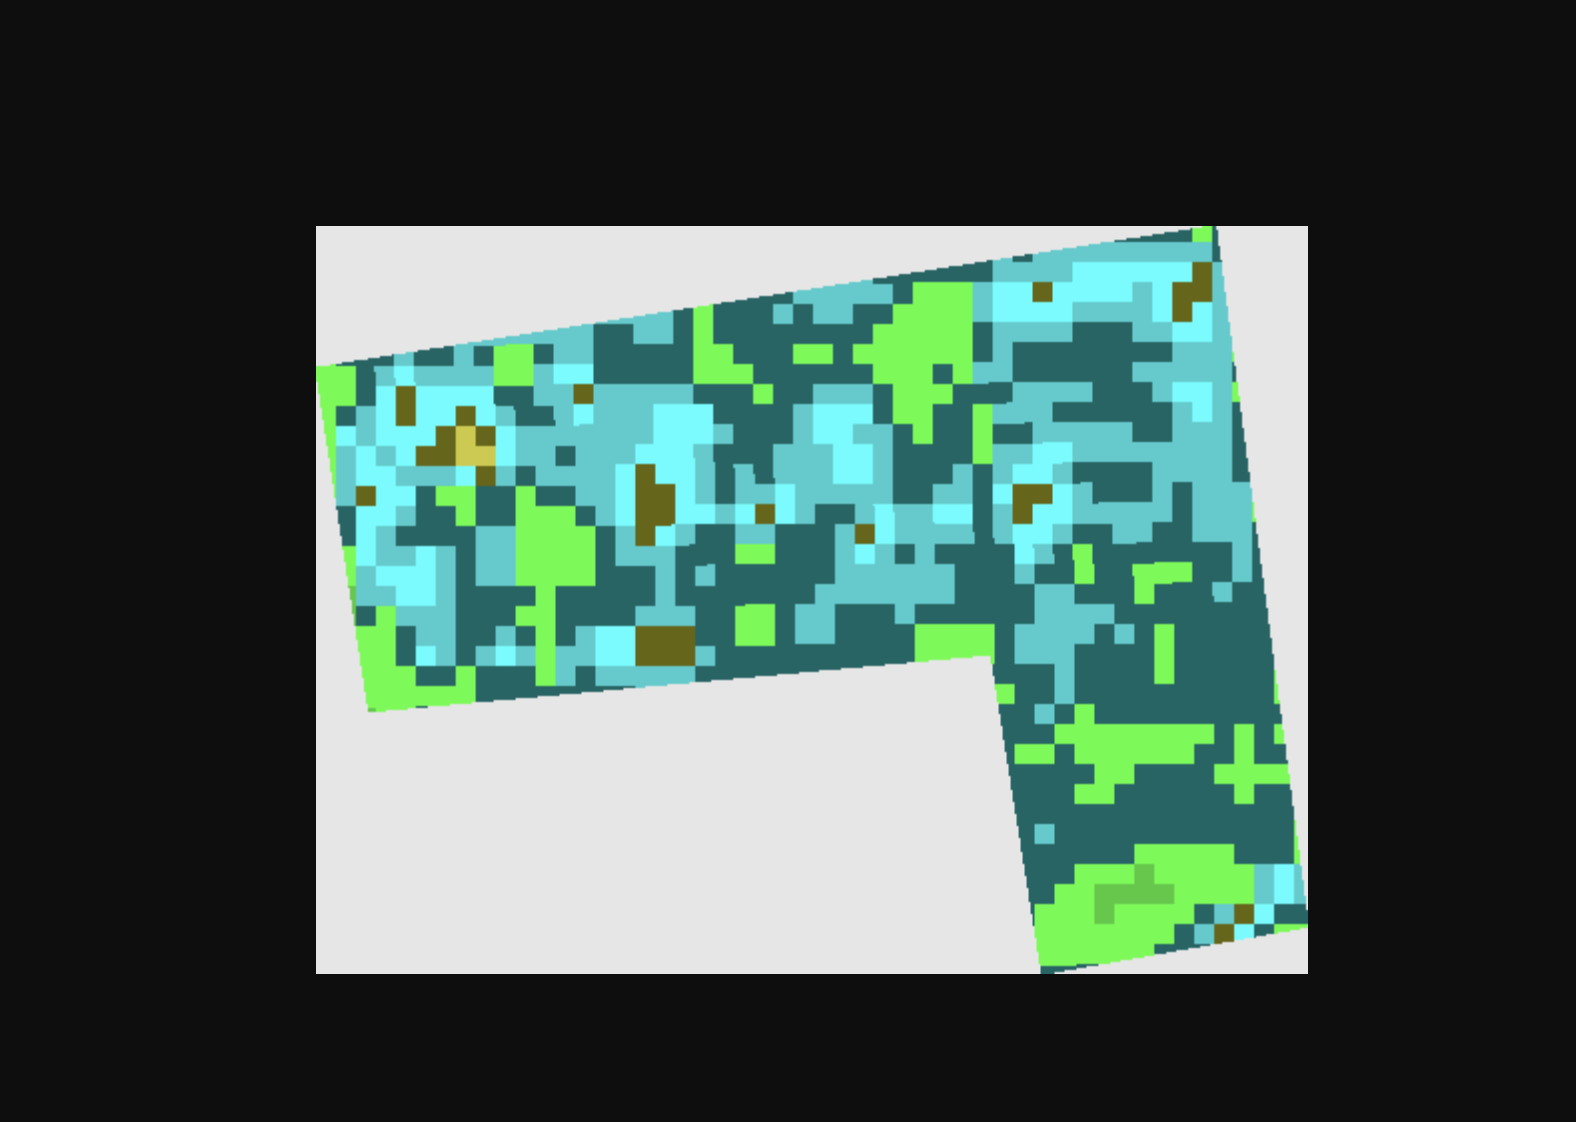
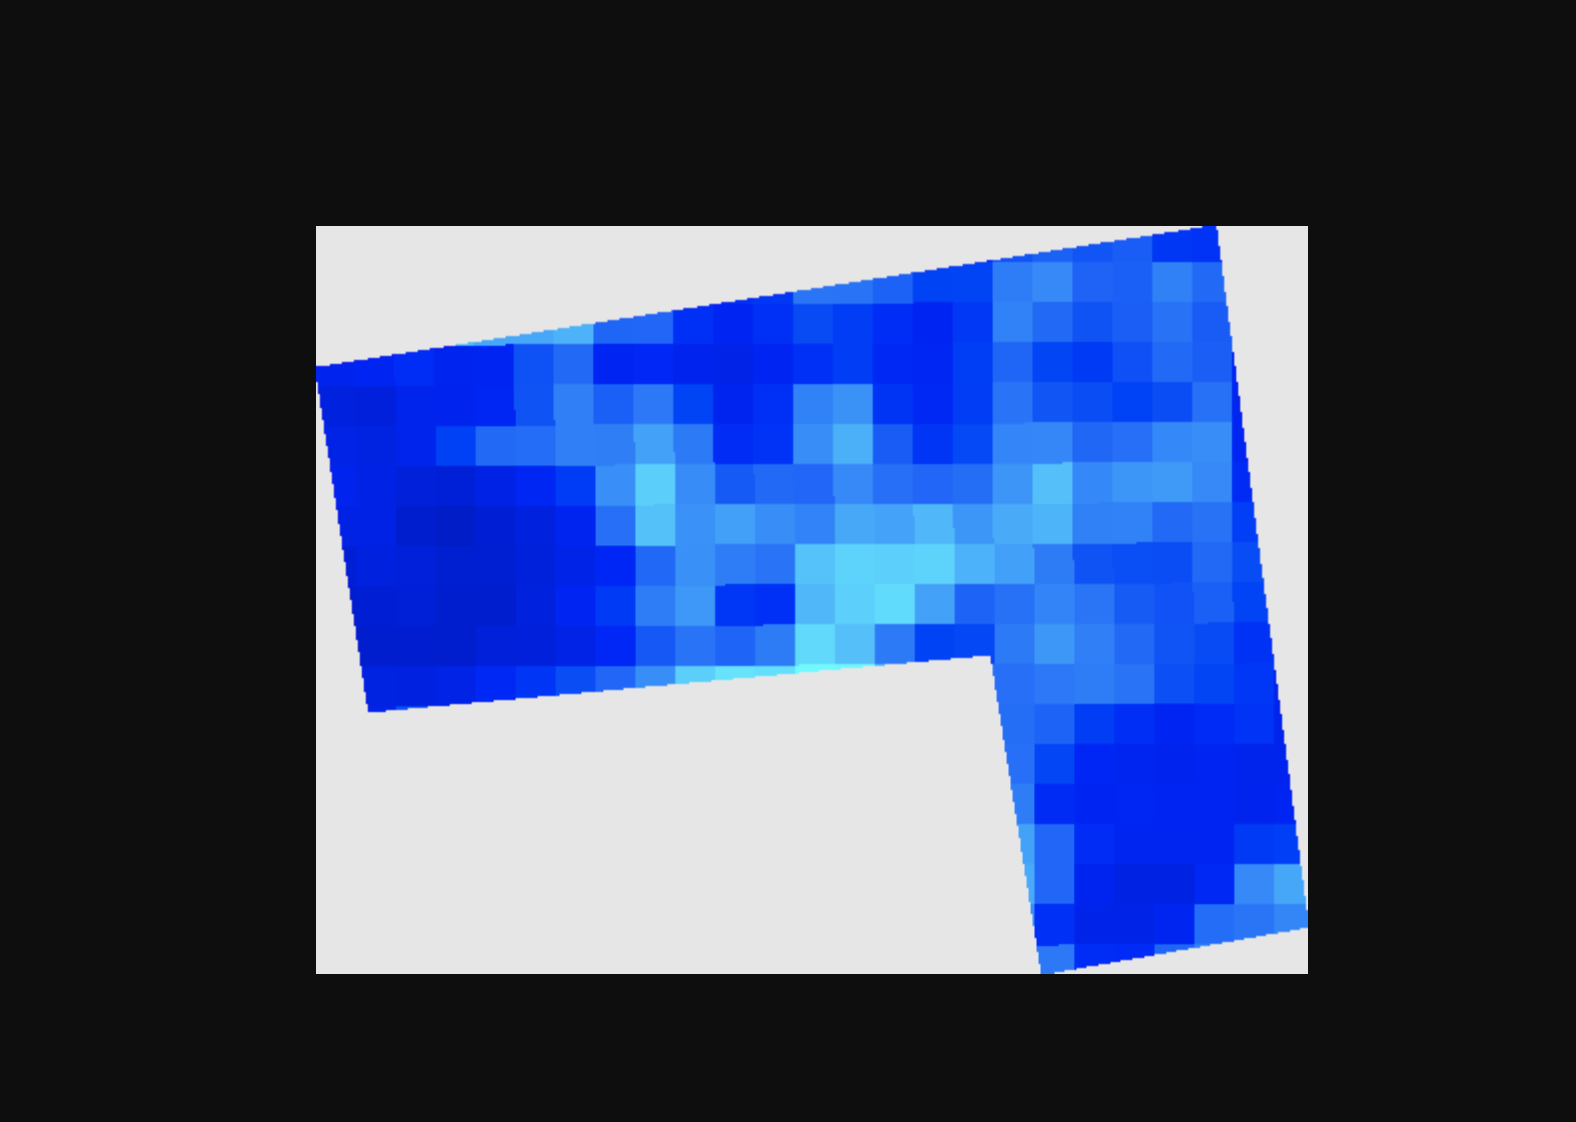
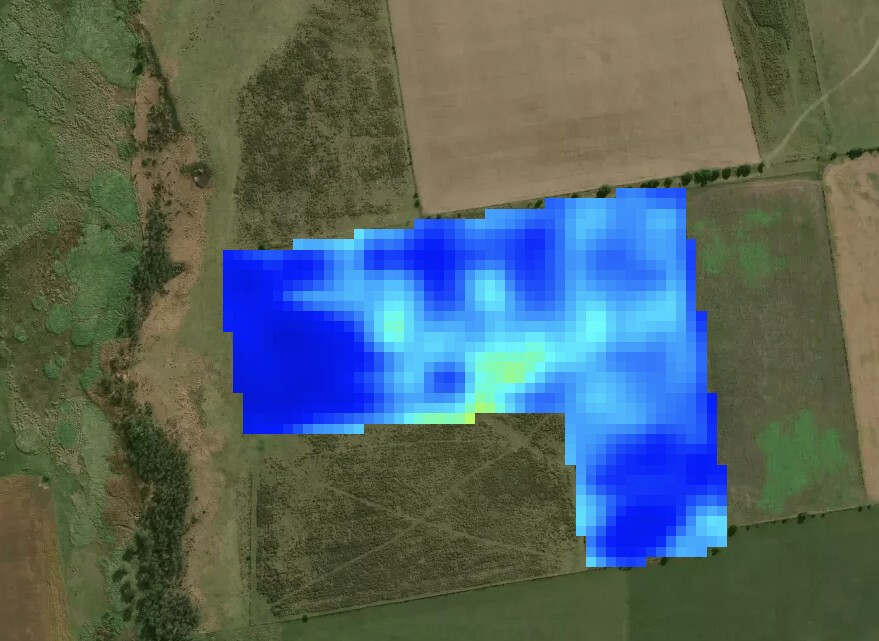
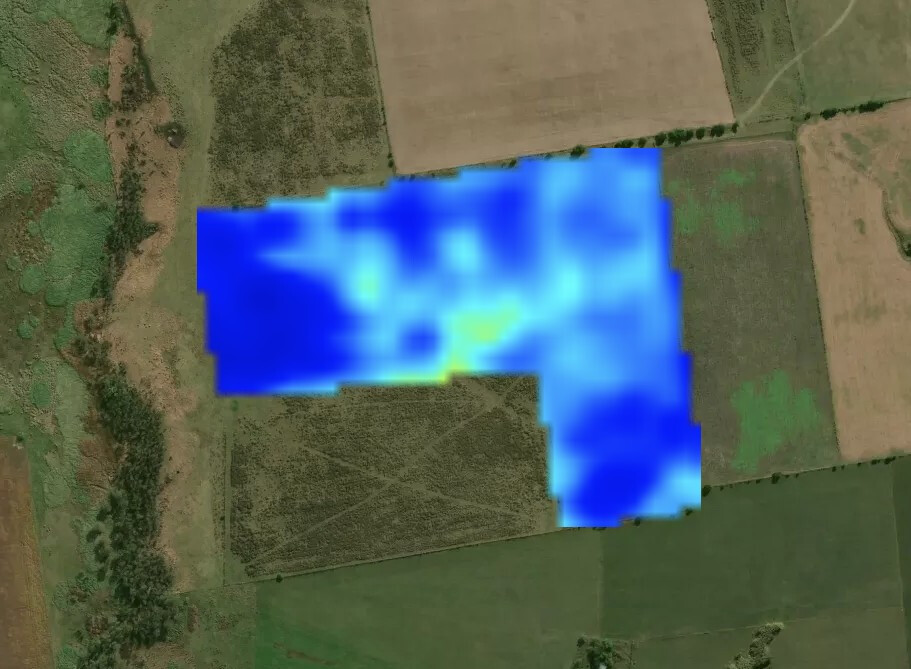
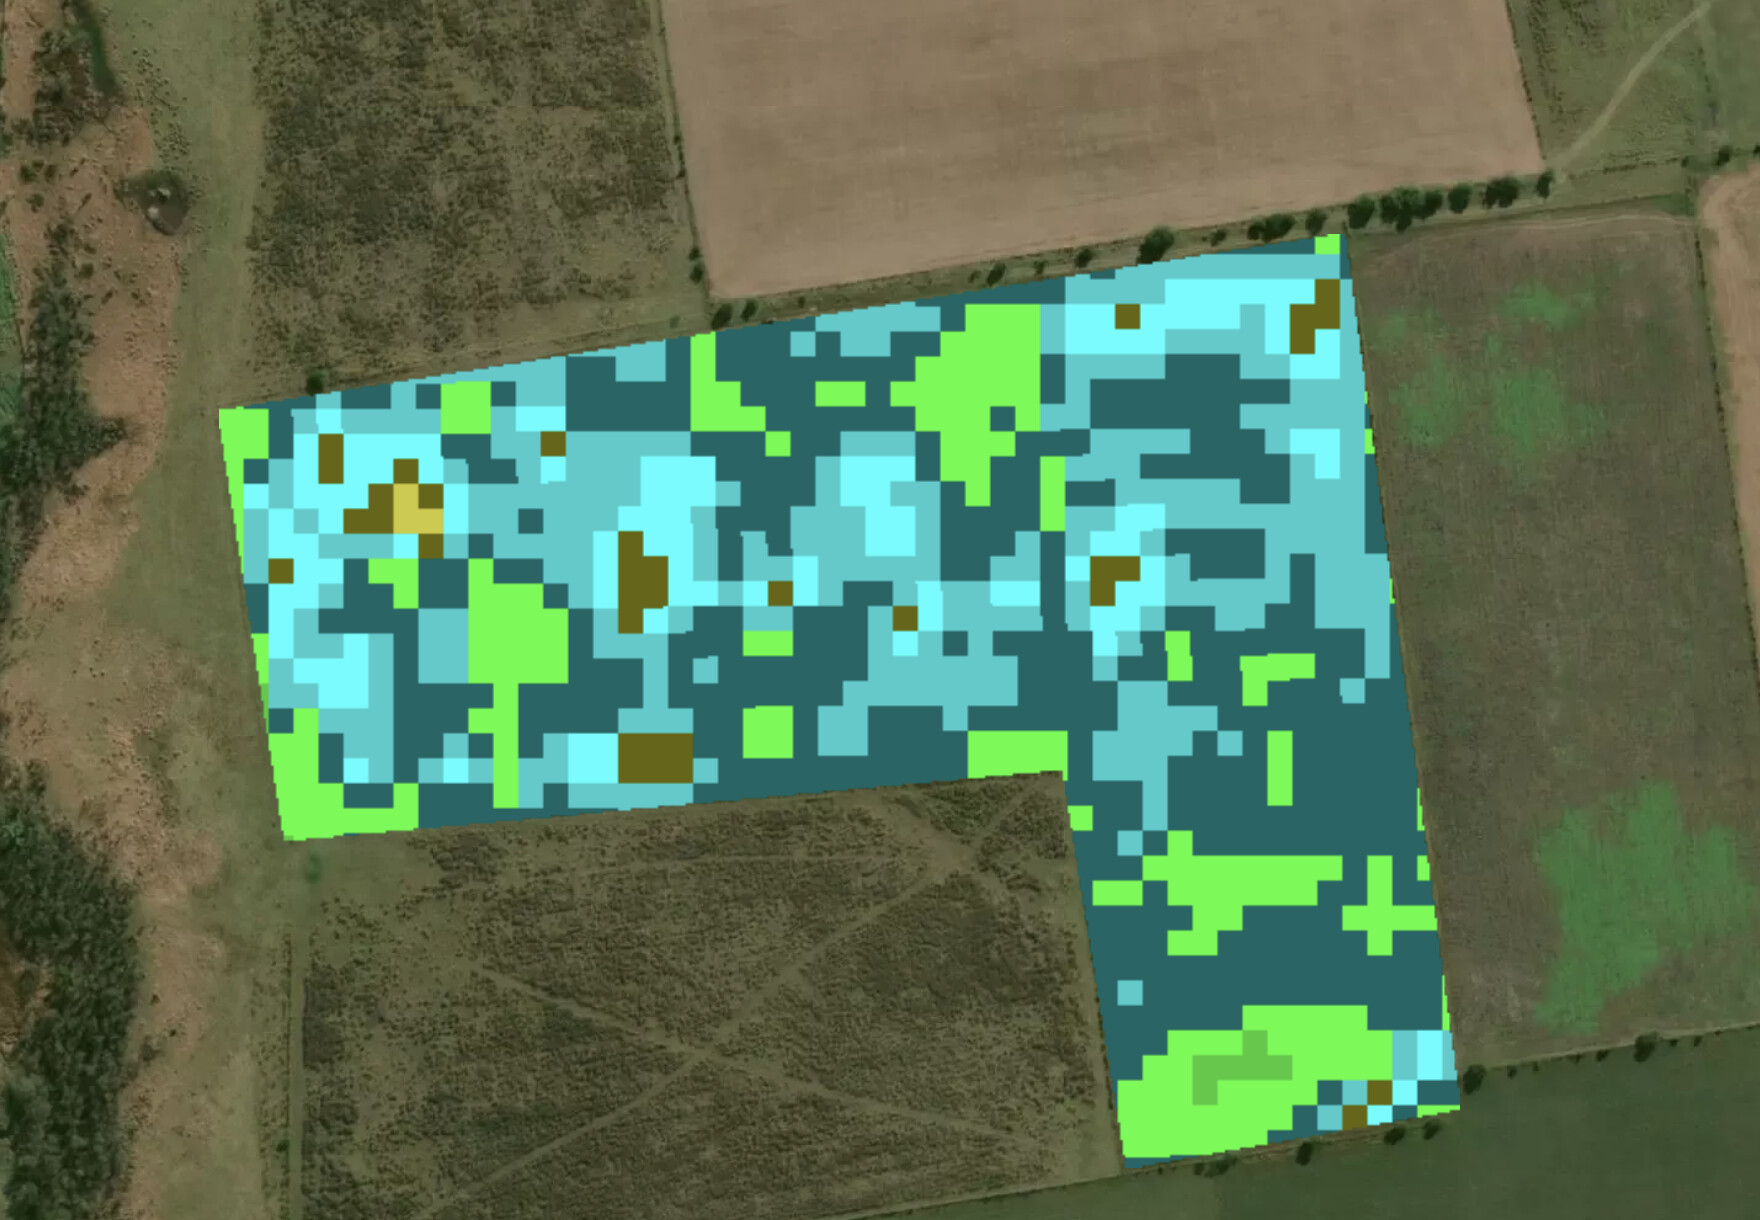
For moisture index images, I see pixels twice the size of the ones from NDVI index. I understand that for NDVI both 10m bands are used, but for moisture, both of them are 20m (B8A and B11).
Is there a way that I can show 10m pixels for the moisture index even though both bands are 20m?
I’ve tried changing resX, resY, playing with upsampling and downsampling but haven’t got any luck yet.
I also understand that given that both bands are 20m, trying to display 10m pixels (just to have same amount as NDVI) will end up in 4 pixels that will have the exact same value for all of them as the 1 big 20m pixel, it’s just a visualization correction I want to make to show the user the same “image quality”.

Moisture index URL:
https://services.sentinel-hub.com/ogc/wms/{INSTANCE_ID}?version=1.1.1&service=WMS&request=GetMap&format=image%2Fpng&srs=EPSG%3A4326&layers=WATER&bbox=-56.55031340714116%2C-34.30415816017349%2C-56.54490607376714%2C-34.30079915457462&resX=1m&resY=1m&showLogo=false&geometry=POLYGON((-56.55031340714116+-34.30143728734698%2C-56.55002372856755+-34.30297942153015%2C-56.54663341637273+-34.30272240113271%2C-56.54635446663518+-34.30415816017349%2C-56.54490607376714+-34.30394545667925%2C-56.54541032906194+-34.30079915457462%2C-56.55031340714116+-34.30143728734698))

NDVI URL:
https://services.sentinel-hub.com/ogc/wms/{INSTANCE_ID}?version=1.1.1&service=WMS&request=GetMap&format=image%2Fpng&srs=EPSG%3A4326&layers=NDVI&bbox=-56.55031340714116%2C-34.30415816017349%2C-56.54490607376714%2C-34.30079915457462&resX=1m&resY=1m&showLogo=false&geometry=POLYGON((-56.55031340714116+-34.30143728734698%2C-56.55002372856755+-34.30297942153015%2C-56.54663341637273+-34.30272240113271%2C-56.54635446663518+-34.30415816017349%2C-56.54490607376714+-34.30394545667925%2C-56.54541032906194+-34.30079915457462%2C-56.55031340714116+-34.30143728734698))

Thanks in advance for your help!

Hi @minian.matias

I am struggling to understand your question. Indeed, you can set the resolution of the images using the resX and resY parameters. Therefore the following command:

https://services.sentinel-hub.com/ogc/wms/{INSTANCE_ID}?version=1.1.1&service=WMS&request=GetMap&format=image%2Fpng&srs=EPSG%3A4326&layers=WATER&bbox=-56.55031340714116%2C-34.30415816017349%2C-56.54490607376714%2C-34.30079915457462&resX=10m&resY=10m&showLogo=false&geometry=POLYGON((-56.55031340714116+-34.30143728734698%2C-56.55002372856755+-34.30297942153015%2C-56.54663341637273+-34.30272240113271%2C-56.54635446663518+-34.30415816017349%2C-56.54490607376714+-34.30394545667925%2C-56.54541032906194+-34.30079915457462%2C-56.55031340714116+-34.30143728734698))

will return your Water band at 10 meters resolution.

Since your WATER layer is a visualisation based on bands 11 (20m resolution) and band 8 (10m resolution, not the 20m of band 8A) requesting a resolution of 10 meters as in the above will not resample it.

I also understand that given that both bands are 20m, trying to display 10m pixels (just to have same amount as NDVI) will end up in 4 pixels that will have the exact same value for all of them as the 1 big 20m pixel,

This is also correct. To support your observation, here is an example product at 10 m:

Screenshot from 2021-03-16 17-03-18

And here is a product at 5 m:

Screenshot from 2021-03-16 17-10-02

Although they look the same, you can see that the pixel size is halved by checking the field boundaries.

Maxim

@maxim.lamare Thanks for the quick response!

Yes, I switched the band editing the script to use the B08 instead of B8A so I could see them at a 10m/px res. I went back to the previous conifg (using B8A) and if I use resX=10m and resY=10m then I get this blurry image:


https://services.sentinel-hub.com/ogc/wms/{INSTANCE_ID}?version=1.1.1&service=WMS&request=GetMap&format=image%2Fpng&srs=EPSG%3A4326&layers=WATER&bbox=-56.55031340714116%2C-34.30415816017349%2C-56.54490607376714%2C-34.30079915457462&resX=10m&resY=10m&showLogo=false&geometry=POLYGON((-56.55031340714116+-34.30143728734698%2C-56.55002372856755+-34.30297942153015%2C-56.54663341637273+-34.30272240113271%2C-56.54635446663518+-34.30415816017349%2C-56.54490607376714+-34.30394545667925%2C-56.54541032906194+-34.30079915457462%2C-56.55031340714116+-34.30143728734698))

If I use resX=1m and resY=1m which is the WATER request I sent in my first comment, then I see the first water image I uploaded which seems to be 20m/px res. So my question is, keeping B8A band, how do I get the px resolution I want seeing that apparently passing 10m doesn’t work, at least for me. Am I missing something in the request?

Well, now that I think about it, it seems to be the right m/px res, but the image is low quality. Even if I see the response on Chrome it seems that it’s really small:

Can I get that same m/px resolution but with better quality so I don’t get a blurry image when showing it? I’ve tried playing with width and height in the request but those are params to replace resX and resY based on what I read.

What software are you using to display the image? The reason I am asking is twofold: first, when I run your request in the post above and change png to tiff then open it in QGIS, I get the following product:

Screenshot from 2021-03-17 16-01-17

Second, I know that some software tries to make the image “look better” by applying a smoothing filter. This means that the “blurring” comes from the software and not the image returned by the service. For example, when downloading the same image and opening it with GNOME image viewer, I get this automatic filter applied:

Concerning the small images in Chrome, this is expected behaviour. You are requesting an image with few pixels due to the resolution of 10 meters and the size of your polygon (~50*40px). Therefore the image will look small in your image viewer or browser (a QIS program will stretch out the image on the map knowing the pixel size). If you request an image with 1 meter resolution for example, it will be a lot bigger in your browser (more pixels).

Hope this helps,

Hi Maxim, thanks again for helping!

I’m showing the image on a web app with React and Mapbox maps library. Not sure if Mapbox is trying to apply a smoothing filter, I think it’s more related on the quality of the image.

I might be missing some technical understanding about this then, cause I’m still unsure on how to achieve what I want. :confused:

My question then is, can I get more colored squares for that field, without loosing image quality? Can I have the same amount of squares as NDVI index without loosing image quality?
In other words, I want the same quality image (not blurry), but more squares representing each 10m of that field instead of less squares representing each 20m of that field, so it is the same amount as the NDVI index shows.
If I use B08 it works out of the box, I think because that one is 10m res.

Hope this makes my question clearer, thank you!

Hi again Matias,

I asked some of the front-end developers, and it seems that Mapbox-gl (is that what you are using?) does apply some smoothing:

One solution could be to switch from the default linear resampling to nearest. This would allow you to show the pixels without blurring. Another user had a similar problem and this solution was pointed out to him on Github.

Once this is solved, your other question will be also: when you request for example your layer with WMS with a resolution of 5m, you will see that the pixels are 4 times smaller than for 10m.

Maxim

Hi Maxim!

Yes, I’m using that library. I’ve tried changing the raster-resampling to nearest but it just shows a black square instead of the image. I still don’t think that’s the issue, but I will try looking through mapbox github to see if anyone has any related issue.

To your second answer, maybe we are talking about different things, and I’m sorry if I misled the conversation the wrong way. I’m really new to all this, but, changing the resX and resY values, doesn’t change the colored squares within the field (don’t wanna say pixels just in case so I’ll refer to them as colored squares), maybe they do change the amount of pixels, which is what you are confirming, but what I need is for each colored square within the field to represent the same amount of space in that field.

NDVI with resX=1m and resY=1m:

NDVI with resX=5m and resY=5m:

So changing those values, this just makes the returned image bigger or smaller, but the amount of colored squares within the field is the same, 14 horizontal squares if you measure the width of the right standing rectangle.

While using the water index with resX=1m and resY=1m just gives me 7 colored squares within the field (for that same measure I previously described):

I was trying to have the same amount of colored squares as NDVI index returns. I will keep looking into it, but not sure if there’s a way. I think I’ll end up using the B08 band which does provide the same amount of colored squares within the field as NDVI.

Thanks for all the support!

Hi Matias

Regarding Mapbox-gl, is it possible that there is a typo in your code after trying raster-resampling? I had a look and the following worked for me.

map.on("load", function () {
  map.addSource("overlay-source", {
    type: "image",
    url:
      "https://services.sentinel-hub.com/ogc/wms/{INSTANCE_ID}?version=1.1.1&service=WMS&request=GetMap&format=image%2Fpng&srs=EPSG%3A4326&layers=WATER&bbox=-56.55031340714116%2C-34.30415816017349%2C-56.54490607376714%2C-34.30079915457462&resX=10m&resY=10m&showLogo=false&geometry=POLYGON((-56.55031340714116+-34.30143728734698%2C-56.55002372856755+-34.30297942153015%2C-56.54663341637273+-34.30272240113271%2C-56.54635446663518+-34.30415816017349%2C-56.54490607376714+-34.30394545667925%2C-56.54541032906194+-34.30079915457462%2C-56.55031340714116+-34.30143728734698))",
    coordinates: [
      [-56.55031340714116, -34.3007991545746],
      [-56.54490607376714, -34.3007991545746],
      [-56.54490607376714, -34.30415816017349],
      [-56.55031340714116, -34.30415816017349],
    ],
  });

  map.addLayer({
    id: "overlay",
    source: "overlay-source",
    type: "raster",
    paint: { "raster-resampling": "nearest" },
  });
});

nearest

linear

It’s sometimes hard to communicate when we don’t speak the same technical language, but let’s not have that get in our way :slight_smile:
I’ll try giving an explanation about pixel size and resampling, hoping that it is the answer you are looking for. If this is obvious to you I apologise in advance.

The animation below is the result from a request over your AOI with the following evalscript:

//VERSION=3

let index = (B8A - B11)/(B8A + B11);
let val = colorBlend(index, [-0.8, -0.24, -0.032, 0.032, 0.24, 0.8], [[0.5,0,0], [1,0,0], [1,1,0], [0,1,1], [0,0,1], [0,0,0.5]]);
val.push(dataMask);
return val;

The resolution was set to 20m, corresponding to the native resolution of band 8A. To make things clearer I have drawn a grid over the pixels:

20m_res

Now if we call the WMS request with a resolution of 10 meters, the default resampling method is nearest neighbour. With this method, we aren’t “inventing” any data. The pixels will be indeed smaller, but they will inherit the value of the 20 m in which they are located. So the product looks the same, but the number of pixels increases (you just can’t see the pixels because they have the same value). Overlaying a grid helps visualise the pixels:

10m_res

If you were to use a more “fancy” resampling algorithm you would see a difference, because of some interpolation, but I think this could be misleading as you would essentially be creating information (if you do so, you have to keep in mind the purpose of the resampling and its limitations).

Maxim

Thanks for the replies @maxim.lamare @grensburg !

I think I have a better idea now regarding resampling, pixels, etc. I’ll work with that, and related to mapbox, I did have the key and value written correctly, but it may be something else, if this works for you @grensburg should work for me as well.

I’ll dig into that as well.

Thanks for all the support! :+1: