Adding a legend, and help with LST mapping - EO Browser, Landsat

Hi all,

I am a 5th year architecture student @ Cornell, and for my thesis I am dealing w/ UHI, inequality in thermal stress and other types of comfort in Phoenix.

I want to do some thermal mapping with Landsat, and while the default script is good, it is in K, and not adapted for true surface mapping I believe. I found this script from the github by Mohor Gartner:

I am having some trouble though, since I am very new at coding…

Namely, I just want to be able to add legend data to the script so that when I download an image, there is a legend…

And I want to change the color scale, when I try to change this line :

let viz = ColorGradientVisualizer.createRedTemperature(minC, maxC);

particularly, the “Red” portion to change the colors, I see there are these available scales here :

greenWhite
BlueRed
redTemperature

and more…
but when I sub in for a different color, I get this error:

Failed to evaluate script!
evalscript.js:46: TypeError: ColorGradientVisualizer.createblueRedTemperature is not a function
let viz = ColorGradientVisualizer.createblueRedTemperature(minC, maxC);
^
TypeError: ColorGradientVisualizer.createblueRedTemperature is not a function
at evalscript.js:46:35

In addition, there are some other issues in the script editor, that I do not know how to fix :


I know there it does not matter much since it is // out, but what does the ? mean?

at line 139, I get an error “i is already defined”

// calc final stdev value
for (var i=0;i<LSTarray.length;i++) {
	LSTstd=LSTstd+(Math.pow(LSTarray[i]-LSTavg, 2));
}	
LSTstd=(Math.pow(LSTstd/(LSTarray.length-1), 0.5));

At line 146, and 148 I get an error "Misleading Line break at ‘?’

// WHICH LST to output, it depends on option variable: 0 for one image analysis (OE Browser); MULTI-TEMPORAL: 0->avg; 1->max; 2->stdev
let outLST= (option==0)
	? LSTavg
	: (option==1)
		? LSTmax
		: LSTstd;

In the first lines of the script there are 3 functions to choose from :
// for analysis of one image (OE Browser), choose option=0. In case of MULTI-TEMPORAL analyis, option values are following:
// 0 - outputs average LST in selected timeline (% of cloud coverage should be low, e.g. < 10%)
// 1�- outputs maximum LST in selected timeline (% of cloud coverage can be high)
// 2 - outputs standard deviation LST in selected timeline; minTemp and highTemp are overwritten with values 0 and 10 (% of cloud coverage should be low, e.g. < 5%)
var option = 1;

If I change var option = 1 though to 0, or 1, or 2, the output is always the same. Is there somewhere else I am suppose to change this in the script too? or why is it not working?

Thanks in advance, from a newbie coder.

~Remy

Hi @rsm278 ,

evalscript.js:46: TypeError: ColorGradientVisualizer.createblueRedTemperature is not a function

This error means that createblueRedTemperature in not a pre-defined function. All pre-defined functions can be found here. If you wish to have your own color scale, the ColorRampVisualizer will do the job. For example, the following script can generate a color ramp from red to blue in a range of 200 to 300.

const ramps = [
  [200, 0xff0000],
  [300, 0x0000ff ],
];

const visualizer = new ColorRampVisualizer(ramps);

visualizer.process(199); // [ 1, 0, 0 ]
visualizer.process(200); // [ 1, 0, 0 ]
visualizer.process(250); // [ 0.5019607843137255, 0, 0.5019607843137255 ]
visualizer.process(299); // [ 0.011764705882352941, 0, 0.9882352941176471 ]
visualizer.process(300); // [ 0, 1, 0 ]

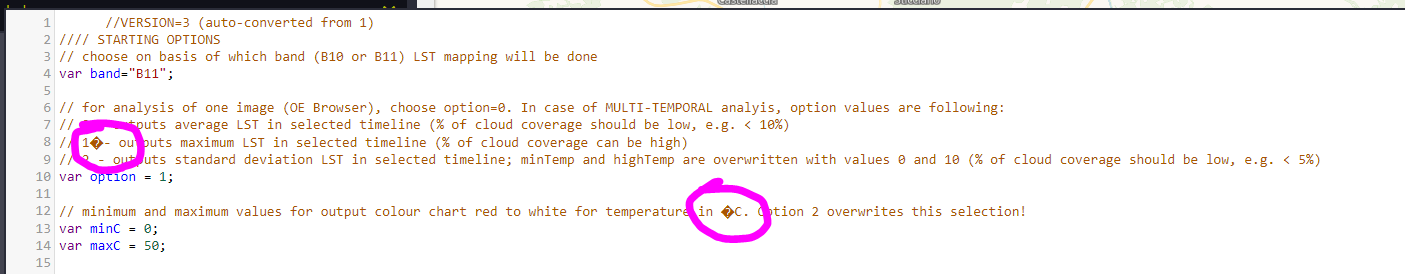
Regarding the question marks in the commented lines, I believe the one at line 12 is °C as you can see in the script at line 110 the degree Kelvin is converted to the degree Celsius. The other question mark at line 8 is probably an error caused by format or font. I will do a double check.

At line 139, 146, and 148 I get warnings but errors. In general, it does not crash the script but you can do the following to avoid those warnings.

// calc final stdev value
for (var j=0;j<LSTarray.length;j++) {
	LSTstd=LSTstd+(Math.pow(LSTarray[j]-LSTavg, 2));
}	
LSTstd=(Math.pow(LSTstd/(LSTarray.length-1), 0.5));
// WHICH LST to output, it depends on option variable: 0 for one image analysis (OE Browser); MULTI-TEMPORAL: 0->avg; 1->max; 2->stdev
let outLST= (option==0) ? LSTavg : (option==1) ? LSTmax : LSTstd;

The output is always the same because the default mosaicking is SIMPLE, which flattens the mosaicked image so only a single sample is passed to evaluation (only one value is returned so the average and maximum are the same). To make the options work you have to specify mosaicking: "ORBIT" under the setup() function and remove the square brackets at line 147.

Here’s an example:

//VERSION=3 (auto-converted from 1)
//// STARTING OPTIONS
// choose on basis of which band (B10 or B11) LST mapping will be done
var band="B10";

// for analysis of one image (OE Browser), choose option=0. In case of MULTI-TEMPORAL analyis, option values are following:
// 0 - outputs average LST in selected timeline (% of cloud coverage should be low, e.g. < 10%)
// 1�- outputs maximum LST in selected timeline (% of cloud coverage can be high)
// 2 - outputs standard deviation LST in selected timeline; minTemp and highTemp are overwritten with values 0 and 10 (% of cloud coverage should be low, e.g. < 5%)
var option =2;

// minimum and maximum values for output colour chart red to white for temperature in �C. Option 2 overwrites this selection!
var minC = 0;
var maxC = 50;


////INPUT DATA - FOR BETTER RESULTS, THE DATA SHOULD BE ADJUSTED
// NVDIs for bare soil and NDVIv for full vegetation
// Note: NVDIs for bare soil and NDVIv for full vegetation are needed to be evaluated for every scene. However in the custom script, default values are set regarding:
// http://profhorn.meteor.wisc.edu/wxwise/satmet/lesson3/ndvi.html 
// https://www.researchgate.net/post/Can_anyone_help_me_to_define_a_range_of_NDVI_value_to_extract_bare_soil_pixels_for_Landsat_TM
// NVDIs=0.2, NDVIv=0.8
// other source suggests global values: NVDIs=0.2, NDVIv=0.5; https://www.researchgate.net/publication/296414003_Algorithm_for_Automated_Mapping_of_Land_Surface_Temperature_Using_LANDSAT_8_Satellite_Data
var NDVIs=0.2;
var NDVIv=0.8;	

// emissivity
var waterE=0.991;
var soilE=0.966;
var vegetationE=0.973;
//var buildingE=0.962;
var C=0.009; //surface roughness, https://www.researchgate.net/publication/331047755_Land_Surface_Temperature_Retrieval_from_LANDSAT-8_Thermal_Infrared_Sensor_Data_and_Validation_with_Infrared_Thermometer_Camera

//central/mean wavelength in meters, B10 or B11
var bCent= (band=="B10") ? 0.000010895 : 0.000012005;

// rho =h*c/sigma=PlanckC*velocityLight/BoltzmannC
var rho=0.01438; // m K

//// visualization
// if result should be std dev (option=2), overwrite minMaxC.
if (option==2) {
	minC = 0;
	maxC = 25;	
}
let viz = ColorGradientVisualizer.createRedTemperature(minC, maxC);


function setup() {
  return {
    input: [{
      bands: [
          "B03",
          "B04",
          "B05",
          "B10",
          "B11"
      ]
    }],
    output: { bands: 3 },
    mosaicking: "ORBIT" 
  }
}


//emissivity calc
//https://www.researchgate.net/publication/296414003_Algorithm_for_Automated_Mapping_of_Land_Surface_Temperature_Using_LANDSAT_8_Satellite_Data
//https://www.academia.edu/27239873/Investigating_Land_Surface_Temperature_Changes_Using_Landsat_Data_in_Konya_Turkey
function LSEcalc(NDVI,Pv) {
	var LSE;
	if (NDVI < 0) {
		//water
		LSE=waterE;
	} else if (NDVI < NDVIs) {
		//soil
		LSE=soilE;
	} else if (NDVI > NDVIv) {
		//vegetation
		LSE=vegetationE;
	} else {
		//mixtures of vegetation and soil
		LSE=vegetationE*Pv+soilE*(1-Pv)+C; 
	}
	return LSE;
}

function evaluatePixelOrig(samples) {
	// starting values max, avg, stdev, reduce N, N for multi-temporal
	var LSTmax=-999;
	var LSTavg=0;
	var LSTstd=0;
	var reduceNavg=0;	
	var N=samples.length;
	
	//to caputure all values of one pixel for for whole timeline in mosaic order
	var LSTarray = [];
	
	// multi-temporal: loop all samples in selected timeline
	for (var i=0;i<N;i++) {
		//// for LST
		// B10 or B11
		var Bi= (band=="B10") ? samples[i].B10 : samples[i].B11;
		var B03i = samples[i].B03;
		var B04i = samples[i].B04;
		var B05i = samples[i].B05;
		
		// some images have errors, whole area is either B10<173K or B10>65000K. Also errors, where B04 and B05 =0. Therefore no processing if that happens, in addition for average and stdev calc, N has to be reduced!
		if ((Bi>173 && Bi<65000) && (B03i>0 && B04i>0 && B05i>0)) {
		// ok image
			//1 Kelvin to C
			var b10BTi=Bi-273.15;			
			//2 NDVI - Normalized Difference vegetation Index
			var NDVIi=(B05i-B04i)/(B05i+B04i);			
			//3 PV - proportional vegetation
			var PVi=Math.pow(((NDVIi-NDVIs)/(NDVIv-NDVIs)), 2);			
			//4 LSE land surface emmisivity	
			var LSEi=LSEcalc(NDVIi,PVi);			
			//5 LST
			var LSTi=(b10BTi/(1+(((bCent*b10BTi)/rho)*Math.log(LSEi))));
			////temporary calculation
			//avg
			LSTavg=LSTavg+LSTi;
			//max
			if (LSTi>LSTmax) {LSTmax=LSTi;}			
			//array
			LSTarray.push(LSTi);			
		} else {
		// image NOT ok
			++reduceNavg;
		}		
	}
	// correct N value if some images have errors and are not analysed
	N=N-reduceNavg;
	// calc final avg value
	LSTavg=LSTavg/N;
	// calc final stdev value
	for (var j=0;j<LSTarray.length;j++) {
		LSTstd=LSTstd+(Math.pow(LSTarray[j]-LSTavg, 2));
	}	
	LSTstd=(Math.pow(LSTstd/(LSTarray.length-1), 0.5));
	// WHICH LST to output, it depends on option variable: 0 for one image analysis (OE Browser); MULTI-TEMPORAL: 0->avg; 1->max; 2->stdev
	let outLST= (option==0)? LSTavg : (option==1) ? LSTmax : LSTstd;
	//// output to image
	return viz.process(outLST);
}
function evaluatePixel(sample, scene, metadata, customData, outputMetadata) {
  return evaluatePixelOrig(sample, scene, metadata, customData, outputMetadata);
}

Note: Legend can only be added with the plotting package, e.g. matplotlib for Python. You may want to remove the visualiser in the script to return actual values, so you can render a color map and have the legend with it.

@chung.horng @gmilcinski
Can you please elaborate on this point?
I tried to comment out viz and return LST values but got an error that the output should be an array…

//return viz.process(outLST);|
return outLST[0];|

Server response: "{"status": 400, "reason": "Bad Request", "message": "Failed to evaluate script!\nundefined:1126: evaluatePixel must return an array\n throw \"evaluatePixel must return an array\";\n ^\n", "code": "RENDERER_EXCEPTION"}"

Hi @aghandour ,

The evaluatePixel expects its output as an array to handle time series. The error should be fixed by putting your outLST[0] into an array [outLST[0]].

It is recommended to go through the evalscript section of our documentation and all the related materials to have a general idea about how evalscript works.

1 Like

thank you @chung.horng
I tried the suggested approach which solved the previous error…
But still I am not able to extract output degree Celsius. The current output is either 255 or zeros.
I tried to change the output from 3 bands to 1 with no luck.
Please advise.
cc @arwa.atheel

# Thermal infrared : Band 10 and 11

Thermal_Band = """

//VERSION=3 (auto-converted from 1)

//// STARTING OPTIONS

// choose on basis of which band (B10 or B11) LST mapping will be done

var band="B10";

// for analysis of one image (OE Browser), choose option=0. In case of MULTI-TEMPORAL analyis, option values are following:

// 0 - outputs average LST in selected timeline (% of cloud coverage should be low, e.g. < 10%)

// 1 - outputs maximum LST in selected timeline (% of cloud coverage can be high)

// 2 - outputs standard deviation LST in selected timeline; minTemp and highTemp are overwritten with values 0 and 10 (% of cloud coverage should be low, e.g. < 5%)

var option = 0;

// minimum and maximum values for output colour chart red to white for temperature in °C. Option 2 overwrites this selection!

var minC = 0;

var maxC = 50;

////INPUT DATA - FOR BETTER RESULTS, THE DATA SHOULD BE ADJUSTED

// NVDIs for bare soil and NDVIv for full vegetation

// Note: NVDIs for bare soil and NDVIv for full vegetation are needed to be evaluated for every scene. However in the custom script, default values are set regarding:

// http://profhorn.meteor.wisc.edu/wxwise/satmet/lesson3/ndvi.html 

// https://www.researchgate.net/post/Can_anyone_help_me_to_define_a_range_of_NDVI_value_to_extract_bare_soil_pixels_for_Landsat_TM

// NVDIs=0.2, NDVIv=0.8

// other source suggests global values: NVDIs=0.2, NDVIv=0.5; https://www.researchgate.net/publication/296414003_Algorithm_for_Automated_Mapping_of_Land_Surface_Temperature_Using_LANDSAT_8_Satellite_Data

var NDVIs=0.2;

var NDVIv=0.8;  

// emissivity

var waterE=0.991;

var soilE=0.966;

var vegetationE=0.973;

//var buildingE=0.962;

var C=0.009; //surface roughness, https://www.researchgate.net/publication/331047755_Land_Surface_Temperature_Retrieval_from_LANDSAT-8_Thermal_Infrared_Sensor_Data_and_Validation_with_Infrared_Thermometer_Camera

//central/mean wavelength in meters, B10 or B11

var bCent= (band=="B10") ? 0.000010895 : 0.000012005;

// rho =h*c/sigma=PlanckC*velocityLight/BoltzmannC

var rho=0.01438; // m K

//// visualization

// if result should be std dev (option=2), overwrite minMaxC.

if (option==2) {

  minC = 0;

  maxC = 25;  

}

let viz = ColorGradientVisualizer.createRedTemperature(minC, maxC);

function setup() {

  return {

    input: [{

      bands: [

          "B03",

          "B04",

          "B05",

          "B10",

          "B11"

      ]

    }],

    output: { bands: 3 }

  }

}

//emissivity calc

//https://www.researchgate.net/publication/296414003_Algorithm_for_Automated_Mapping_of_Land_Surface_Temperature_Using_LANDSAT_8_Satellite_Data

//https://www.academia.edu/27239873/Investigating_Land_Surface_Temperature_Changes_Using_Landsat_Data_in_Konya_Turkey

function LSEcalc(NDVI,Pv) {

  var LSE;

  if (NDVI < 0) {

    //water

    LSE=waterE;

  } else if (NDVI < NDVIs) {

    //soil

    LSE=soilE;

  } else if (NDVI > NDVIv) {

    //vegetation

    LSE=vegetationE;

  } else {

    //mixtures of vegetation and soil

    LSE=vegetationE*Pv+soilE*(1-Pv)+C; 

  }

  return LSE;

}

function evaluatePixelOrig(samples) {

  // starting values max, avg, stdev, reduce N, N for multi-temporal

  var LSTmax=-999;

  var LSTavg=0;

  var LSTstd=0;

  var reduceNavg=0; 

  var N=samples.length;


  //to caputure all values of one pixel for for whole timeline in mosaic order

  var LSTarray = [];


  // multi-temporal: loop all samples in selected timeline

  for (var i=0;i<N;i++) {

    //// for LST

    // B10 or B11

    var Bi= (band=="B10") ? samples[i].B10 : samples[i].B11;

    var B03i = samples[i].B03;

    var B04i = samples[i].B04;

    var B05i = samples[i].B05;    


    // some images have errors, whole area is either B10<173K or B10>65000K. Also errors, where B04 and B05 =0. Therefore no processing if that happens, in addition for average and stdev calc, N has to be reduced!

    if ((Bi>173 && Bi<65000) && (B03i>0 && B04i>0 && B05i>0)) {

    // ok image

      //1 Kelvin to C

      var b10BTi=Bi-273.15;     

      //2 NDVI - Normalized Difference vegetation Index

      var NDVIi=(B05i-B04i)/(B05i+B04i);      

      //3 PV - proportional vegetation

      var PVi=Math.pow(((NDVIi-NDVIs)/(NDVIv-NDVIs)), 2);     

      //4 LSE land surface emmisivity 

      var LSEi=LSEcalc(NDVIi,PVi);      

      //5 LST

      var LSTi=(b10BTi/(1+(((bCent*b10BTi)/rho)*Math.log(LSEi))));


      ////temporary calculation

      //avg

      LSTavg=LSTavg+LSTi;     

      //max

      if (LSTi>LSTmax) {LSTmax=LSTi;}     

      //array

      LSTarray.push(LSTi);      

    } else {

    // image NOT ok

      ++reduceNavg;

    }   

  }

  // correct N value if some images have errors and are not analysed

  N=N-reduceNavg;


  // calc final avg value

  LSTavg=LSTavg/N;


  // calc final stdev value

  for (var i=0;i<LSTarray.length;i++) {

    LSTstd=LSTstd+(Math.pow(LSTarray[i]-LSTavg, 2));

  } 

  LSTstd=(Math.pow(LSTstd/(LSTarray.length-1), 0.5));


  // WHICH LST to output, it depends on option variable: 0 for one image analysis (OE Browser); MULTI-TEMPORAL: 0->avg; 1->max; 2->stdev

  let outLST= (option==0)

    ? LSTavg

    : (option==1)

      ? LSTmax

      : LSTstd;


  //// output to image

  //return viz.process(outLST);

  return [outLST];

}

function evaluatePixel(sample, scene, metadata, customData, outputMetadata) {

  return evaluatePixelOrig([sample], [scene], metadata, customData, outputMetadata);

}

"""

request_Thermal_Band = SentinelHubRequest(

    data_folder="IMAGES",

    evalscript=Thermal_Band,

    input_data=[

        SentinelHubRequest.input_data(

            data_collection=DataCollection.LANDSAT_OT_L1,

            time_interval=("2022-05-26", "2022-05-26"),

        )

    ],

    responses=[SentinelHubRequest.output_response("default", MimeType.TIFF)],

    bbox=betsiboka_bbox,

    size=betsiboka_size,

    config=config,

)

Hi @aghandour ,

There is a parameter sampleType which defines the numeric type of the output raster. The default value of this parameter is AUTO which automatically stretches the value from an interval [0, 1] to [0, 255] and writes into an UINT8 raster. Values below 0 and above 1 will be clamped to 0 and 255, respectively (Find more examples and explanations in the FAQ).

To get the calculated LST value correctly, you need to use FLOAT32 instead. If you’re sure that the expected LST is a positive number and you don’t care about the decimals, UINT16 could also be an option to save PUs. It is recommended to go through our blog post to learn more about sampleType for Sentinel Hub requests.

1 Like

problem fixed…thanks again @chung.horng for your prompt feedback :clap: