Hi everyone!
For the timespan 2015-2018 I have successfully downloaded 10-m S-2 bands (02=B,03=G,04=R,08=NIR) and corresponding NDVI (configured directly in configurator) for some African countries, applying Sinergise’s atmospheric correction filter ATMCOR.
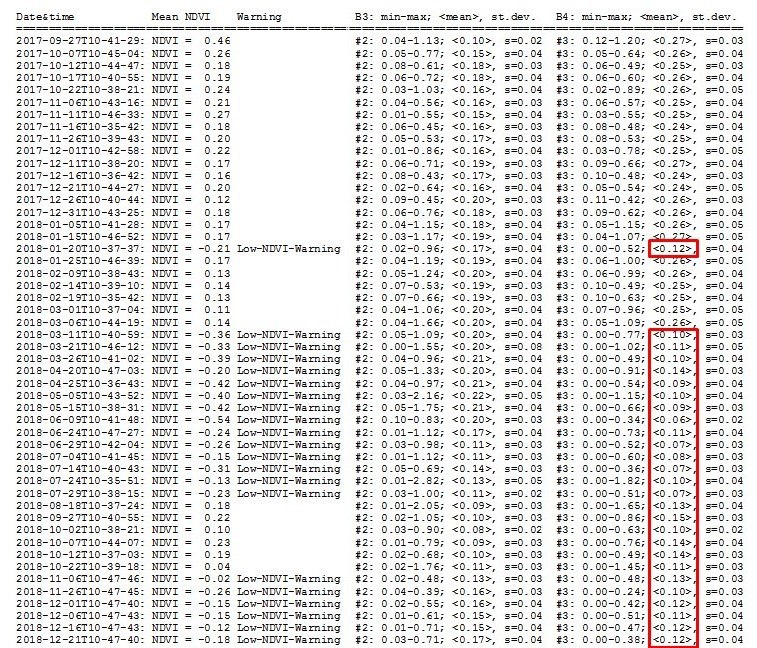
In the ATMCOR-corrected values of NIR band there is a significant drop from around March 10, 2018, onwards. Due to this anomaly in NIR band the NDVI values are completely wrong (the mean NDVI value of the 50x50 km2 area may be as low as -0.60, which is not possible for such diverse landcover).
Other facts:
The same anomaly is not found in the ATMCOR-corrected images of same African areas in previous years 2015-2017
The same anomaly is not found in the non-atmosph.-corrected images of same African areas in the ‘problematic’ year 2018
The same anomaly is not found on some test images of Slovenia in 2018
I am not aware that Copernicus did some changes in the processing chains in March 2018 (I far as I understand the processing baseline version 02.06 is from October 2017, while 02.07 is from November 2018)
Below I attach an example of mean NDVI and statistics of Red and NIR bands for some region of Burkina Faso (timespan 2017-09 to 2018-12; approx center location in UTM 30 N: 450000.0, 1380000.0)
Best regards, peter
Hi Peter,
thanks for sharing this. Generally, ATMCOR option is a statistical function, which does not work in all cases perfectly (the imperfection is true for all other atmospheric corrections as well). It is especially problematic near clouds and on steep terrains. We therefore recommend you check for nearby clouds and add some buffer, skipping the affected scenes/dates.
Best,
Grega
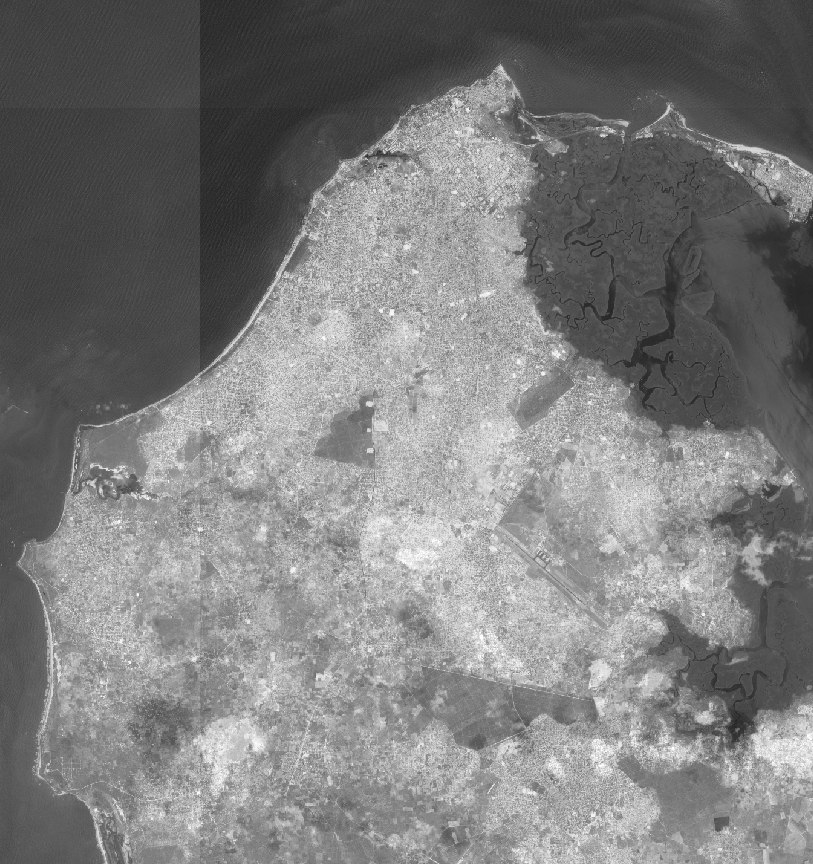
Our first thought were indeed clouds. However, it was soon clear, that the sudden “drop of ATMCOR-corrected NIR band” from March 2018 onward is not connected to clouds (and neither to haze). E.g. see previews of subsequent images (dates from 2018-03-11 to 2018-05-15) corresponding to the above given table. They all have strongly negative mean NDVI, however on the images there are practically no clouds or haze.
The second our thought was landcover. Since images are from Africa, there is a lot of semi-arid areas which have much higher reflectance than normally assumed. Indeed when I tried some very small areas, it was obvious that semi-arid areas are more prone to expose the “drop of ATMCOR-corrected NIR band” problem from March 2018.
As the third thing, which may or may not be connected to the above given issue, is the problem of a kind of “sections in ATMCOR-corrected NIR band”. See image below, you can see that there are visible sections (a kind of grid) in the left and upper part of the corrected NIR band. Also this problem emerges from March 2018 onwards.
For the end let me just stress the fact that is the most surprising. On images acquired prior to March 2018 both the described anomalies, i.e the “drop of the ATMCOR-corrected NIR band” and the “sections in ATMCOR-corrected NIR band”, also occur, however very rarely, in some special individual instances. However after March 2018 they are almost regular!
It is a real mystery! So, my first assumption would be that somewhere in the process there is some change, either on Copernicus side, or on Sentinel-Hub side, that causes images from March 2018 onwards to process differently.
But did any of the processes really changed? I think that they did not.
Hi Peter,
what did change is Sen2Cor module used for our “run-time optimized atmospheric correction”. I am not sure, when exactly this happened, but we do usually update the version soon after it is available by ESA.
The “gridding” is probably related to neighborhood scenes, right? The ATMCOR parameters are calculated per scene level.
Best,
Grega