Average of daily CH4 Tropomi S5P data to single monthly file

Respected Sir/Ma’am,

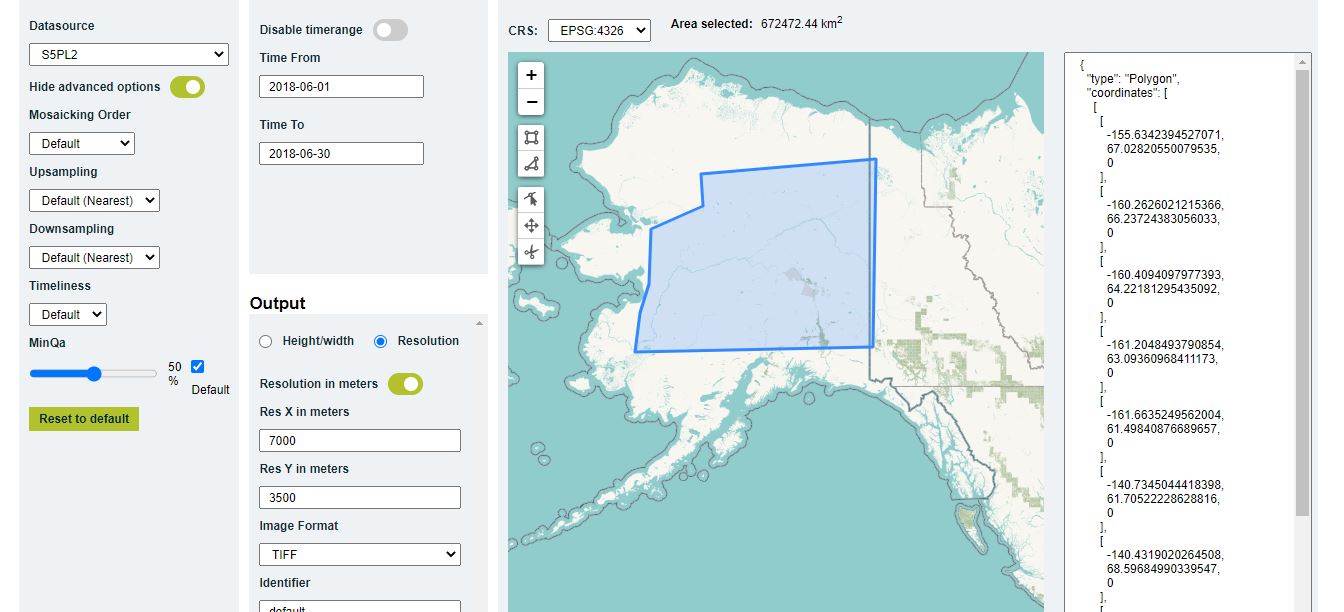
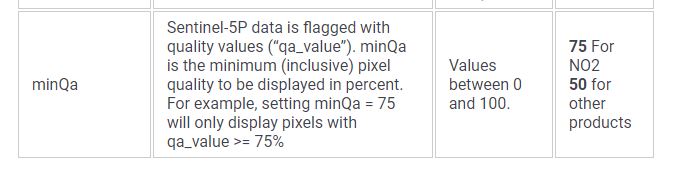
I am a masters student, I came across the tutorial for request builder using API. It is very convenient but I am facing a challenge. I can only download daily data, if I am trying to give a time period of one month it does not give me an average data for all the days of that month. Could you provide a link as to where I can find how to average daily data to monthly for TROPOMI CH4 S5P.

I came across this but it did not help.

image.png

I apologize if any inconvenience is caused. Any assistance will be highly appreciated. Further attesting my script.

curl -X POST https://creodias.sentinel-hub.com/api/v1/process
-H ‘Content-Type: application/json’
-H ‘Authorization: Bearer my-token’
-d ‘{
“input”: {
“bounds”: {
“bbox”: [
-162.10821,
60.716197,
-140.830616,
67.908619
],
“properties”: {
“crs”: “http://www.opengis.net/def/crs/EPSG/0/4326
}
},
“data”: [
{
“type”: “S5PL2”,
“dataFilter”: {
“timeRange”: {
“from”: “2020-04-13T00:00:00Z”,
“to”: “2020-04-23T23:59:59Z”
}
}
}
]
},
“output”: {
“resx”: 5500,
“resy”: 3500,
“responses”: [
{
“identifier”: “default”,
“format”: {
“type”: “image/tiff”
}
}
]
},
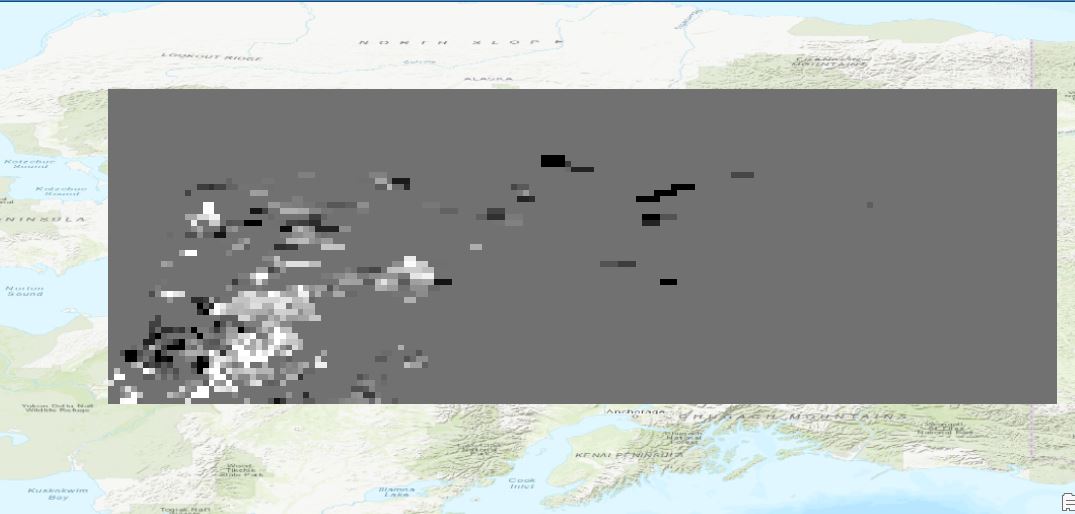
“evalscript”: “//VERSION=3\nfunction setup() {\n return {\n input: [“CH4”, “dataMask”],\n output: { bands: 4 }\n }\n}\nconst minVal = 1600.0\nconst maxVal = 2000.0\nconst diff = maxVal - minVal\nconst rainbowColors = [\n [minVal, [0, 0, 0.5]],\n [minVal + 0.125 * diff, [0, 0, 1]],\n [minVal + 0.375 * diff, [0, 1, 1]],\n [minVal + 0.625 * diff, [1, 1, 0]],\n [minVal + 0.875 * diff, [1, 0, 0]],\n [maxVal, [0.5, 0, 0]]\n]\nconst viz = new ColorRampVisualizer(rainbowColors)\nfunction evaluatePixel(sample) {\n var rgba = viz.process(sample.CH4)\n rgba.push(sample.dataMask)\n return rgba\n}”
}’

Hello,

Just to make sure I understand correctly: the output that you are expecting is a single tiff that represents the average of all acquisitions during the period of time that you are requesting?

I prefer to ask before giving you an example that is not relevant :slight_smile:

Maxim

Yes, that is what I am looking for.

Ok, so first a few comments:

  • There isn’t necessarily data every day (in particular for CH4), to check the data have a look at EOBrowser.
  • In your payload, you set the resolution (resx and resy) to 5500 and 3500 respectively. Please be aware that the resolution specified is in the units of your projection. Here you are requesting data in EPSG:4326, so your resolution is wrong (in degrees). However, there is a new feature in the latest version of Requests Builder to set the resolution in meters. That should help you.

Now for the code:

I get access to all the images using mosaicking: "ORBIT" (more on that here). Then I loop through the valid pixels (see how to access the image stack here) and add up their values. I count the number of valid pixels and divide the addition of valid pixel values by that number. Then I return a transparent layer for no data and your colour bar for valid data.

Of course, you can modify the script to tailor it to your liking.


//VERSION=3
function setup() {
  return {
    input: ["CH4", "dataMask"],
    output: { bands: 4 },
    mosaicking: "ORBIT"
  };
}

//vasudhachaturvedi18's color ramp
const minVal = 1600.0;
const maxVal = 2000.0;
const diff = maxVal - minVal;
const rainbowColors = [
  [minVal, [0, 0, 0.5]],
  [minVal + 0.125 * diff, [0, 0, 1]],
  [minVal + 0.375 * diff, [0, 1, 1]],
  [minVal + 0.625 * diff, [1, 1, 0]],
  [minVal + 0.875 * diff, [1, 0, 0]],
  [maxVal, [0.5, 0, 0]]
];
const viz = new ColorRampVisualizer(rainbowColors);

function evaluatePixel(samples) {
  
  // Initialise CH4
  var CH4 = 0;
  
  // Initialise counter
  var cnt = 0;
  
  // Loop over all samples
  for (i=0; i<samples.length; i++){
    
    // Add values if they are present
    if (samples[i].dataMask === 1){
      CH4 += samples[i].CH4;
      cnt ++;
    }
  }  

  // Return transparent if 0
  if (cnt == 0){
    return [0, 0, 0, 0];
  } else {
    // Divide by number of images
    var CH4_mean = CH4 / cnt;
    
    // Visualise
    var rgba = viz.process(CH4_mean);
    
    // Add transparency layer to visible
    rgba.push(1);
    
    // Return RGB
    return rgba;
  }  
}

There might be a shorter / more elegant way of implementing this, but this method works well.

Thank you, sir, let me have a look and get back to you if I face any further challenges. Thank you for your response and assistance.

I tried understanding and then using the script you have provided but the output of this script is different from what I manually calculated using ArcPRO. The result of this script using request builder is this. request_builder

I manually calculated the average of daily data using ArcPRO for the same month as request builder but it shows different results.

I thought that it would be a similar output but comparing the average daily output using request builder does not show any data for this month whereas on ArcRO it does.
Could you let me know what is the problem I might have done while scripting. I used the same script as provided, where their values that were needed to be changed.

I apologize I am not very familiar with scripting.

If I run the Requests Builder over the same area and time-range that you provided in the payload in your first message, I get:

image

(Here the noData values are in black).

Are you running the script over a different time range / area?

curl -X POST https://creodias.sentinel-hub.com/api/v1/process 
 -H 'Content-Type: application/json' 
 -H 'Authorization: Bearer <my-token>' 
 -d '{
  "input": {
    "bounds": {
      "bbox": [
        -162.10821,
        60.716197,
        -140.830616,
        67.908619
      ],
      "properties": {
        "crs": "http://www.opengis.net/def/crs/EPSG/0/4326"
      }
    },
    "data": [
      {
        "type": "S5PL2",
        "dataFilter": {
          "timeRange": {
            "from": "2020-04-13T00:00:00Z",
            "to": "2020-04-23T23:59:59Z"
          }
        }
      }
    ]
  },
  "output": {
    "width": 209.72690268988802,
    "height": 228.75907274581115,
    "responses": [
      {
        "identifier": "default",
        "format": {
          "type": "image/jpeg"
        }
      }
    ]
  },
  "evalscript": "//VERSION=3\nfunction setup() {\n  return {\n    input: [\"CH4\", \"dataMask\"],\n    output: { bands: 4 },\n    mosaicking: \"ORBIT\"\n  };\n}\n\n//vasudhachaturvedi18's color ramp\nconst minVal = 1600.0;\nconst maxVal = 2000.0;\nconst diff = maxVal - minVal;\nconst rainbowColors = [\n  [minVal, [0, 0, 0.5]],\n  [minVal + 0.125 * diff, [0, 0, 1]],\n  [minVal + 0.375 * diff, [0, 1, 1]],\n  [minVal + 0.625 * diff, [1, 1, 0]],\n  [minVal + 0.875 * diff, [1, 0, 0]],\n  [maxVal, [0.5, 0, 0]]\n];\nconst viz = new ColorRampVisualizer(rainbowColors);\n\nfunction evaluatePixel(samples) {\n  \n  // Initialise CH4\n  var CH4 = 0;\n  \n  // Initialise counter\n  var cnt = 0;\n  \n  // Loop over all samples\n  for (i=0; i<samples.length; i++){\n    \n    // Add values if they are present\n    if (samples[i].dataMask === 1){\n      CH4 += samples[i].CH4;\n      cnt ++;\n    }\n  }  \n\n  // Return transparent if 0\n  if (cnt == 0){\n    return [0, 0, 0, 0];\n  } else {\n    // Divide by number of images\n    var CH4_mean = CH4 / cnt;\n    \n    // Visualise\n    var rgba = viz.process(CH4_mean);\n    \n    // Add transparency layer to visible\n    rgba.push(1);\n    \n    // Return RGB\n    return rgba;\n  }  \n}"
}'

No sir I am using 2018-06-01 to 2018-06-30 as my time range and this the script.
curl -X POST https://creodias.sentinel-hub.com/api/v1/process
-H ‘Content-Type: application/json’
-H ‘Authorization: Bearer my-token’
-d ‘{
“input”: {
“bounds”: {
“geometry”: {
“type”: “Polygon”,
“coordinates”: [
[
[
-155.63424,
67.028205
],
[
-160.262603,
66.237243
],
[
-160.40941,
64.221812
],
[
-161.20485,
63.093609
],
[
-161.663525,
61.498408
],
[
-140.734505,
61.705222
],
[
-140.431903,
68.596849
],
[
-155.806529,
68.108271
],
[
-155.63424,
67.028205
]
]
]
},
“properties”: {
“crs”: “http://www.opengis.net/def/crs/EPSG/0/4326
}
},
“data”: [
{
“type”: “S5PL2”,
“dataFilter”: {
“timeRange”: {
“from”: “2018-06-01T00:00:00Z”,
“to”: “2018-06-30T23:59:59Z”
}
},
“processing”: {
“minQa”: “50”
}
}
]
},
“output”: {
“width”: 160.4038404457318,
“height”: 225.76995792602412,
“responses”: [
{
“identifier”: “default”,
“format”: {
“type”: “image/tiff”
}
}
]
},
“evalscript”: “\n//VERSION=3\nfunction setup() {\n return {\n input: ["CH4", "dataMask"],\n output: { bands: 4 },\n mosaicking: "ORBIT"\n };\n}\n\n//vasudhachaturvedi18’s color ramp\nconst minVal = 1600.0;\nconst maxVal = 2000.0;\nconst diff = maxVal - minVal;\nconst rainbowColors = [\n [minVal, [0, 0, 0.5]],\n [minVal + 0.125 * diff, [0, 0, 1]],\n [minVal + 0.375 * diff, [0, 1, 1]],\n [minVal + 0.625 * diff, [1, 1, 0]],\n [minVal + 0.875 * diff, [1, 0, 0]],\n [maxVal, [0.5, 0, 0]]\n];\nconst viz = new ColorRampVisualizer(rainbowColors);\n\nfunction evaluatePixel(samples) {\n \n // Initialise CH4\n var CH4 = 0;\n \n // Initialise counter\n var cnt = 0;\n \n // Loop over all samples\n for (i=0; i<samples.length; i++){\n \n // Add values if they are present\n if (samples[i].dataMask === 1){\n CH4 += samples[i].CH4;\n cnt ++;\n }\n } \n\n // Return transparent if 0\n if (cnt == 0){\n return [0, 0, 0, 0];\n } else {\n // Divide by number of images\n var CH4_mean = CH4 / cnt;\n \n // Visualise\n var rgba = viz.process(CH4_mean);\n \n // Add transparency layer to visible\n rgba.push(1);\n \n // Return RGB\n return rgba;\n } \n}”
}’

And further attesting the area in Alaska I am looking for with the provided kml file

studyarea.kml (1.8 KB)

It seems that the data that is there for CH4 does not match the minQa requirements that you set. If you slide the minQa slider to 0, you can actually retrieve some data.

I cannot comment on your ArcPRO image, as I have no idea of the data source/processing behind what you show.

Okay sir I will do as you said but as mentioned on the page https://docs.sentinel-hub.com/api/latest/data/sentinel-5p-l2/
The QA should be considered 50 for S5P products. QA

Well you should really be setting the value depending on your algorithm or workflow requirements and the level of quality you are happy with.

The 75% and 50% values mentioned in the table are the default settings in Sentinel Hub and therefore can be changed to the user’s liking.