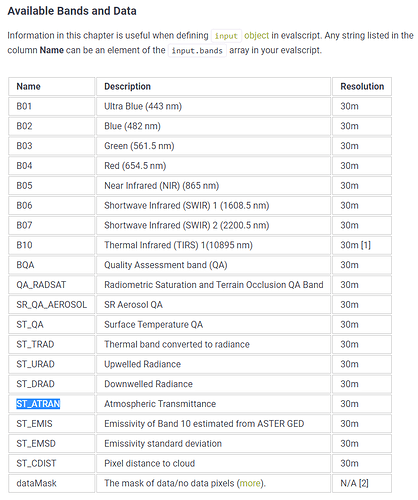
Hello,
i’m interested in Landsat 8 level 2 images.
I’m a bit confused regard the available bands as in USGS it mentioned to have 11 bands, while in sentinel hub configuration utility I see B1-B7 and B10, and it says that the thermal is based on B10. In addition to that I saw here some post regard extra band that relates to clouds but it doesn’t not appear in the bands in the configuration utility.
Are these bands available? and if yes how can I acess them and where can I get information regard all the available bands? 
Dear Reut,
Landsat 8 Level 2 only has 7 optical bands, and 1 thermal band B10. Level 1 is the one with 11 bands. So the products you’re seeing are correct - if you want the 11 bands, consider using Landsat 8 Level 1 collection instead. As a side note - in L1, there was B11 actually missing and was just added, and we also added B10 (next to the already existing thermal band) to make it more consistent.
Data products for Landsat 8 currently only include optical and thermal bands, but you can easily use the other bands in your scripts. Go to our data documentation linked above, and insert the name of any band into the script.
For example, Level 2 has a band called Atmospheric Transmittance with the name ST_ATRAN, which you can insert into the script:
//VERSION=3
function setup() {
  return {
    input: ["ST_ATRAN","dataMask"],
    output: { bands: 2 }
  };
}

function evaluatePixel(sample) {
  return [sample.ST_ATRAN, sample.dataMask ];
}
In EO Browser, you can see the result. Feel free to create new layers with all the bands that are available.
Best,
Monja
2 Likes
Hello Monja,
thank you very much for your detailed amswer.
regard the ST_ATRAN and dataMask layer, where can I see what the differnt result means?
I haven’t seen it here or in usgs about the ATRAN layer. the dataMask I believe is the pixel qa layer?
Best regards
Reut
Dear Reut,
dataMask is a band, that checks if the pixel has data, or if there is no data there. So when you put dataMask into an extra channel (the second one, if you want the grayscale result, or into the fourth one for an RGB result), all pixels with no-data will appear transparent.
Compare the script that uses dataMask with the script without dataMask. When there’s no dataMask, you will see that no-data pixels are black and not transparent. dataMask band is present for all our data collections and is not specific to Landsat.
You can read documentation on dataMask here and here.
As for ATRAN (and other bands), USGS does document it on this page, with more detailed information in the documents linked under “Documentation” part of the page.
Dear Reut,
We have a contradictory example as we use dataMask channel but the resulting images are completely black. The source is Landsat 8 OLI-TIRS-L2 , and the geographic point of interest ( -3.114624, 43.085323, -2.55127, 43.494775). For example, there is an image visible the day 2021-06-05. But when we do a OGC request we obtain a completely black image. With the same procedure but Sentinel data, the extract perfectly all bands. For a concrete test with Landsast 8 L2, we have selected the NDVI COLOR MAP layer, //VERSION=3
let viz = ColorMapVisualizer.createDefaultColorMap();
function evaluatePixel(samples) {
let val = index(samples.B05, samples.B04);
val = viz.process(val);
val.push(samples.dataMask);
return val;
}
function setup() {
return {
input: [{
bands: [
“B04”,
“B05”,
“dataMask”
]
}],
output: {
bands: 4
}
}
}
Thanks in advance,

