Hi all,
could me indicate how calculate the delta Normalized Burn Ratio (dNBR) and NBR (Normalized Burn Ratio) with Sentinel 2 images ?
What bands I must use?
I used SWIR for create in external software area that are burned or not, but now I need to classify the different burned area.
Thanks
Hi!
NBR is calculated as (NIR-SWIR)/(NIR+SWIR). In S2, NIR band is B08. There are two SWIR bands, and as usually SWIR wavelengths of approximately 2000-2300 nm are used, the correct SWIR band for Sentinel-2 would be B12. You can check the available bands here. For NBR, we actually already have an evalscript here.
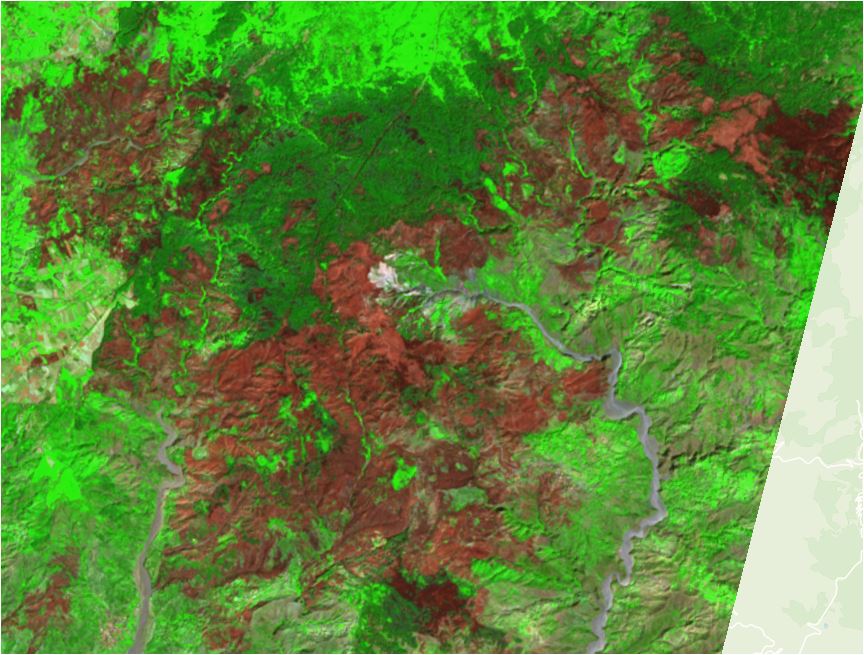
You can also see a direct link to a wildfire in Oregon here.
As NBR is a general normalized difference index, it tends to overestimate, which is expected. Feel free to also check our other scripts for wildfires and burned area monitoring on our custom script repository, if interested in other available visualizations.
dNBR I found in this article to be calculated as a difference between NBR before the fire and NBR after the fire. To create a script for this, you need to use a multi-temporal script to calculate NBR for both dates and then return the difference.
Here is an example of dNBR script for the Oregon wildfire: https://sentinelshare.page.link/2NuE
The date of the wildfire was 2020-09-09, and the selected date before the wildfire is 2019-08-26. These are inserted into preProcessScenes function to limit the available dates. In addition, time range needs to be set to include both dates. In the evaluatePixel function, samples[0] refers to the first available date - after (in this case during) the wildfire, and samples[1] refers to the second available date - before the wildfire. In case you need additional information on custom scripts see this site.
//VERSION=3
function setup() {
  return {
    input: [{
      bands: ["B08","B12"]
    }],
    output: { bands: 1 },
    mosaicking: "ORBIT"
  }
}
function evaluatePixel(samples,scenes) {
  let postFireNBR = (samples[0].B08-samples[0].B12)/(samples[0].B08+samples[0].B12)
  let preFireNBR = (samples[1].B08-samples[1].B12)/(samples[1].B08+samples[1].B12)
  let dNBR = preFireNBR - postFireNBR

  return [dNBR]

}
function preProcessScenes (collections) {
    var allowedDates = ["2020-09-09", "2019-08-26"]; //before and after the fire
    collections.scenes.orbits = collections.scenes.orbits.filter(function (orbit) {
        var orbitDateFrom = orbit.dateFrom.split("T")[0];
        return allowedDates.includes(orbitDateFrom);
    })
    return collections
}
I hope this helps.
Best,
Monja
Thank you Monja, very great answer.
I prefer to use a GIS software external of sentinel hub and download B08 e B12 of fire area.
In grid calculator I set formula for calculate burn ratio. It’s correct have negative values in burned area? If not, I mistake something in formula.
Where find a scale to burn severety, high, moderate and low?
Best Regards-
Antonio
Dear Antonio,
yes, negative values are normal, as NBR ranges from -1 to 1. In NBR, it’s correct to have negative values where the area was burned. If you check the grayscale image of NBR, you will see that the burned pixels are darker, which means they have lower values. For dNBR however, it should be reversed - the burned area should have positive values. You can also see this in the article about the wildfire in Funchal, Madeira, where you can see how they classified the NBR and dNBR in values from -0.5 and 0.5 (the most common pixel values in the area).
For NBR classification - burned areas usually have values between -0.3 to -0.5, but can even get close to -1 when the area is heated (usually either on fire, or recently burned). The values can vary based on how recently the area was burned, any haze present in the image, etc. Here’s also another classification for dNBR. But as said - these classifications could be a bit tweaked for a specific area, and they might not be universal - I can’t judge that without a deeper dive into the field.
Just in case you didn’t know, using EO Browser is completely free (for non-commercial use) and in my opinion much much easier and convenient than doing it locally. You can use it to search and view mosaicked imagery, do analysis on the fly, download TIFF images, make time-lapses, modify gain, gamma and colors of an image, save locations, check histograms and statistics, view satellite data in 3D, use data fusion, etc. You also don’t have to process imagery - for Sentinel-1 for example, you already have RTC, orthorectification and speckle filter ready. And for each satellite, you have several visualizations with descriptions and legends premade. Feel free to check it out if you’d like.