Hi All,
I have been trying to figure out the c values and how they influence the line graph when looking at the moisture index without any luck.
Some background.
We configure our own WMS in the sentinel configurator for use in our own portal. Currently, in our WMS we use the default moisture index as provided in the list of layers. I then use the Sentinel EO browser to test.
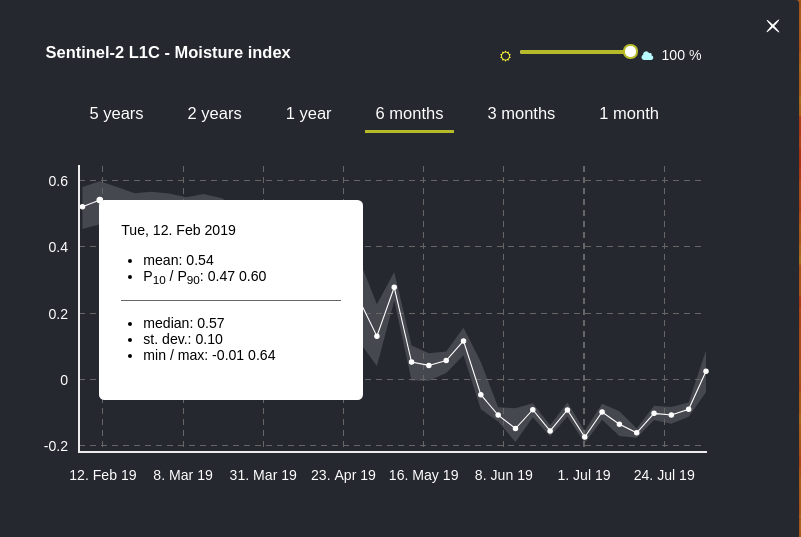
So in the EO browser I choose the default theme. I choose my area and timeframe in question and then display the default moisture index provided. I then chose the statistical info for the area in question. Note this is the default moisture index use in the EO browser under the default theme.

The statistical info then looks as follows (Figure 1):
Next to compare I copy and paste the script of the moisture index in the sentinel configurator (This is the layer we see in our custom portal) to the creat custom rendering tool.
let index = (B8A - B11)/(B8A + B11);
return colorBlend(index, [-0.8, -0.24, -0.032, 0.032, 0.24, 0.8], [[0.5,0,0], [1,0,0], [1,1,0], [0,1,1], [0,0,1], [0,0,0.5]]);
I then choose exactly the same area and timeframe and then choose the statistical info and get the following graph (Figure 2).
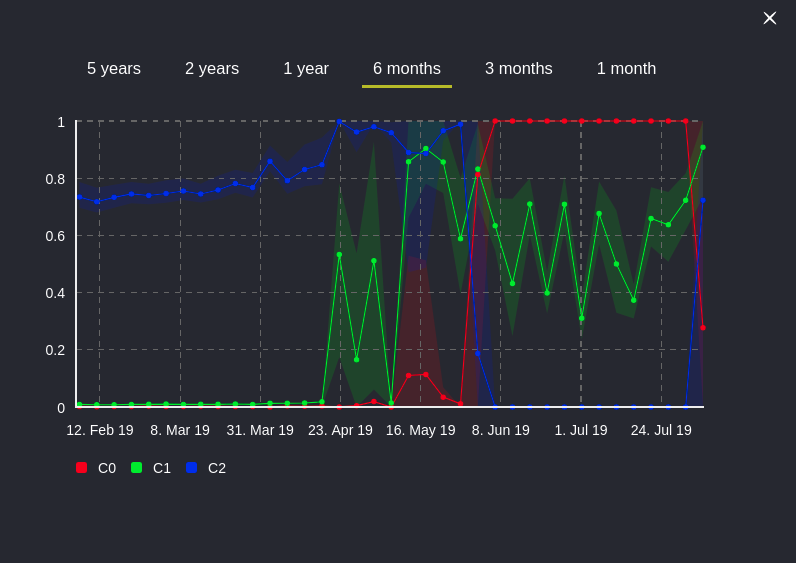
My question is why is there no correlation whatsoever between figure 1 and 2. How do they calculate the values in the graph of figure 1. How do I use the RGB values in figure 2 to have the same graph as in figure 1.
Please help
Thank you