Hi, after completing a PlanetScope analytic_sr_udm2 order I cannot “show data” like I can when ordering analytic_udm2 on EO browser. Any issue with that? Or am I getting something wrong?
Hi @orig ,
Would you mind clarifying the issue a bit? Do you order the data as usual on EO Browser but cannot visualise the data by clicking the show data button, or do you order the data in another way and would like to know how to visualise it on EO Browser?
Thank you.
There’s no show data button at all. I tried ordering both on EO browser and also tried via API (same happens for analytic_8b_sr_udm2). So I would like to know how to visualize it on EO browser and also how to download it please.
Hi @orig ,
From you dashboard you’ll see three data collections with the following IDs: 174xxxxx-xxxx-xxxx-xxxx-xxxxxxxxxba9, c5cxxxxx-xxxx-xxxx-xxxx-xxxxxxxxx66c, and d15xxxxx-xxxx-xxxx-xxxx-xxxxxxxxx0f3. These are the PlanetScope collections you order, no matter through the EO Browser or the API.
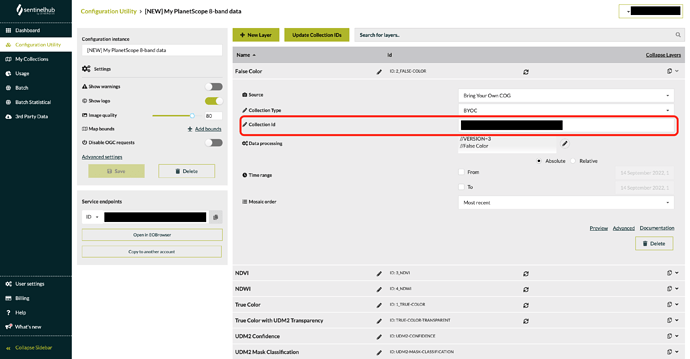
To view the data on EO Browser, you need to create a configuration. As you can see, there is a My PlanetScope 8-band data configuration in your account; however, the collection id (Fig 1) specified in this configuration is not one of the data collections you ordered. You could replace the collection id by one of the above ids, e.g., 174xxxxx-xxxx-xxxx-xxxx-xxxxxxxxxba9 and click the Save Layer button. Note that you’ll need to update all layers so they would work on EO Browser. You can also create a new configuration, please find a step-by-step tutorial in our webinar. After the configuration is correctly set up, you are able to view your data on EO Browser (the webinar also shows how to view the data on EO Browser).
To download the original data, please follow the Data access and download section in our documentation.
Fig 1
Perfect, thanks a lot!
This topic was automatically closed 60 days after the last reply. New replies are no longer allowed.
