Clarification regard the cloud mask for FIS

Hello,

I’m using the FIS in order to generate line chart of the mean NDVI value of a given polygon.
I have seen here that I can filter the clouds in the images by using this costum script:

//VERSION=3
function setup() {
  return {
    input: ["B04", "B08", "CLM"],
    output: { bands: 2 }
  };
}

function evaluatePixel(sample) {
  let ndvi = index(sample.B08, sample.B04);
  return [ndvi, sample.CLM];
}

I have used this script in the configuration utility, but I don’t see big differnce in the line chart before and after the CLM added, and i’m afraid i’m not using it correct.
Is there any more stage to do beside have the CLM band in the costum script?
Do I need to do something in the FIS request so it knows to mask the clouds?

This is how I did the FIS request:

    fis_request = FisRequest(
    data_collection=DataCollection.SENTINEL2_L2A,
    layer='NDVI_VALUES',
    geometry_list=[polygon],
    time=time_interval,
    resolution='10m',
    data_folder='./data2',
    config=config)
    
    fis_data = fis_request.get_data(save_data=True) 
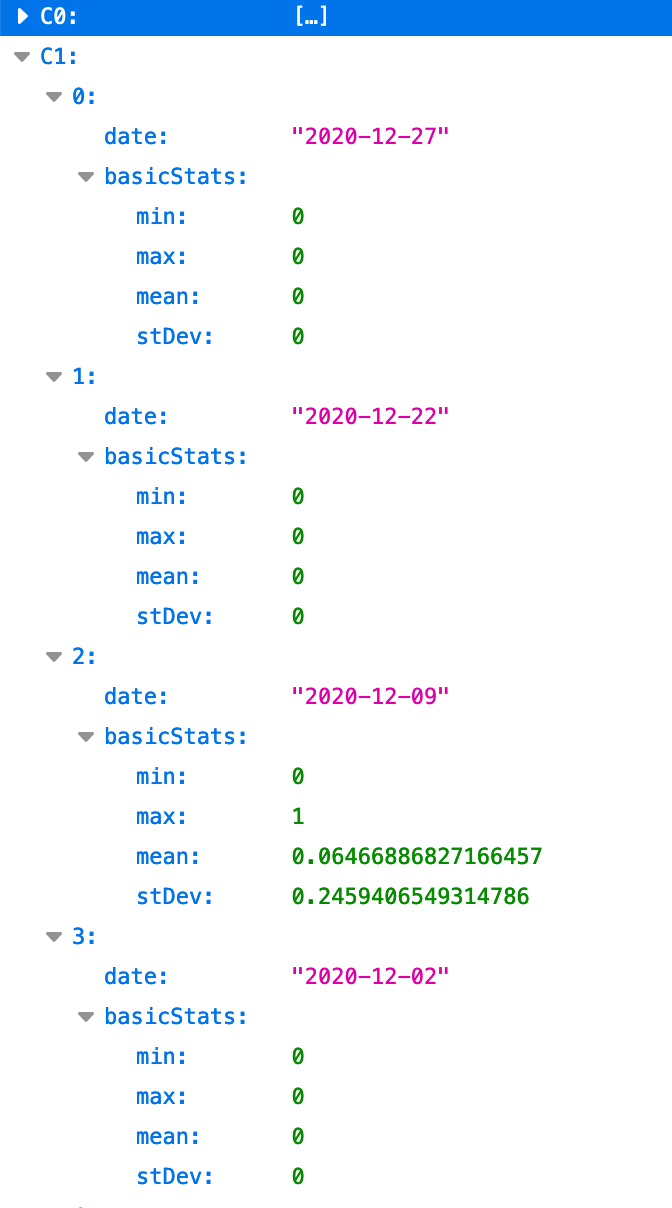
    df = fis_data_to_dataframe(fis_data)
    
    plt.figure(figsize=(10,6))
    df.plot(x='date',y='mean',title=x)
    plt.show()

This is the graph I get:
image
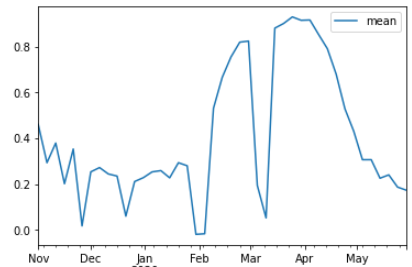
I tend to believe that the result in March and February are clouds.
So I would like to know if there is any further step to do in order to apply the cloud mask.

With the Custom script configured as in your example, FIS service will be returning two outputs - first “channel” will be NDVI and the second one the average value of CLM over the area (1=fully cloudy, 0=not cloudy, 0.3 = 30% pixels are cloudy).
I am not sure how sentinelhub-py handles two-channel outputs but when charting the data, you would need to “filter” for parts with “second channel<0.3” (or similar).

it returns only one band

df['channel'].unique().tolist()

[0]

I constructed a FIS request in line with what you are trying to execute (I believe). You will have to replace the instance ID with the one you are using.

https://services.sentinel-hub.com/ogc/fis/e034c959-MASKED.?LAYER=NDVI_VALUES&TIME=2020-10-01/2021-01-01&RESOLUTION=10m&CRS=EPSG:4326&GEOMETRY=POLYGON%20((38.208188%20-4.216003,%2038.159086%20-4.251022,%2038.123993%20-4.211884,%2038.14667%20-4.145279,%2038.208188%20-4.216003))

If you run this in the browser, you will notice, that there are two channels, with C1 representing statistics over CLM band.

I am not sure how to do the same in the sentinelhub-py, but if you simply execute this request and parse results, you can do what you want to achieve, I believe.