Hello,
currently I want to create NDVI and NDWI pictures with the python API for sentinelhub.
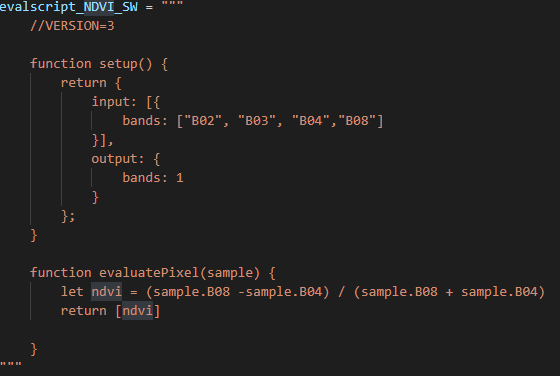
My evalscript for NDVI looks like that:
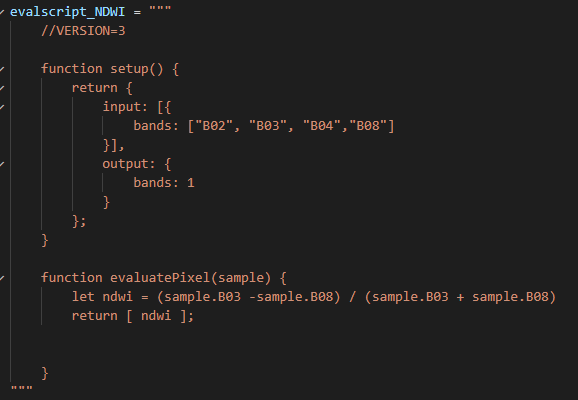
And for NDWI:
It works fine for NDVI. In the case of NDWI, I only get a black picture.
So, I want to understand how the NDWI picture is created. How the transformation of the values from -1 to 1 ( what we get, when we calculate let ndwi, let ndvi) to 0 - 255 works.
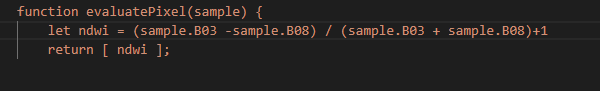
Because when i add plus one:
It works. I get an image, which looks good. But i don’t know if it is correct…
Working with indices it is always good to understand, what is a typical value range for the results. NDVI, at least the usually interesting part, is between 0 and 1. NDWI, however has often values below 0 as well.
As you do not have sampleType defined in your Evalscript, default is used, which is UINT8. See description in the link document:
`
values should range from 0-1, which will then automatically be stretched from the interval [0, 1] to [0, 255] and written into an UINT8 raster. Values below 0 and above 1 will be clamped to 0 and 255, respectively.
There are two ways to solve this:
to use FLOAT32 as a sampleType, which will ensure you get all the values (but some GIS tools will have a trouble working with such output)
to ensure in your Evalscript that the ndwi values are mapped into the range of [0,255[. You can check how the exemplary script is done.
`
As a side note - make sure that in input you only request for bands that you need in the script (i.e. for ndvi there is no need to ask for B02 and B02). It will execute faster and will consume less processing units. See this blog post with some further tips:
Thank you!
I think only the second way works for me, because right now i am requesting PNG images. And therefore the additional information from Float32, I can’t use?
How much more Information i would get when i request tiff images…? We want to detect field boarders… Do you think there would be a significant effect?
It’s impossible to tell this as there is no general rule. You would have to check. Sentinel-2 has a range of value 0-10000 (cca), the relevant ones going from 0-4000 (the rest is usually cloud or over-exposure). So with 8 bit you get cca 10% of the detail.
Okay, thanks… I will give it a try…
Because we only need a small image, i am searching for a method, to only prevent the coordinates in the middle in the picture and always get a picture for example with a width of 5 km and height of 5 km. Do you have any suggestions?
Yes , thanks, it works!
What happens, when i request a Image with 2500 Pixel x 2500 Pixel and i have a box with 2,5 km x 2,5 km ? Then one Pixel would be one meter… But Sentinel 2 has only 10 m resolution. So is there a interpolation to get more details? Or 10 Pixel in the requested image would represent one pixel from the sentinel 2 original image?
You can make use of bicubic interpolation to make it visually more appealing. That said, the information is there still at the 10-meter level. So when asking for 1-meter pixels, you are really just interpolating it…
Hello,
maybe you can help me again, i think , i don’t solved the problem with the coordinates. I think i have a problem with the conversion between the coordinate systems, because i don’t get quadratic bounding boxes with for example 2500 meter to the left and to the wright…
Maybe i get something from the basics wrong, so first of all i have a question, how do you know where youre gps position is, in a downloaded satellite image? I thought, when i know that the resolution is in x and y direction 10 meter per pixel and i Know the coordinates of the bounding box , I can count pixelwise into the field… Like when you go 100 pixel from the bottom into the picture, then you made a real distance from 1000 meter…
So please let me know if there is an easier way… (only for information, i am working with the pictures in Matlab, if this is important)
Maybe i should specify what i want to do: I get an GPS-Position, then i want a get satellite images from this position with this point in the center, then i am going to segment this image and start from the pixel referring to the real GPS Position. so my thought was, to get a satellite image where this point is in the center of the image, then i dont have to think about it and can always start in the center…?
Thanks for your help in advance!
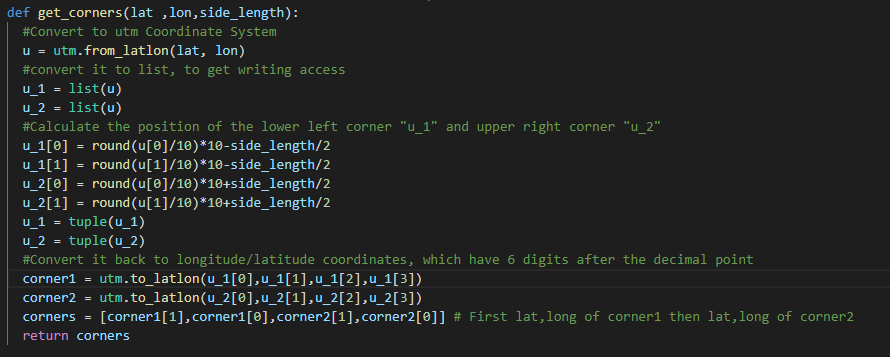
This was my function to get the corner of a square with lat and lon in the center: