Hi.
I would like to be able to display only values over a cut off limit. For example I would like to visualize only data from the Sentinel 5p NO2 where pixel values are greater than a parameter value.
Also, is it possible to have transparency in the resulting image overlay?
You can configure your own product as described here:
https://www.sentinel-hub.com/faq/how-create-eo-product
See an example of visualization based on various values for NDVI:
You should be able to apply this to S5P data as well.
For transparency check this post:
https://www.sentinel-hub.com/faq/how-can-i-make-some-pixels-transparent
Hi.
Unfortunately, the NDVI script still displays all values. What I would like to have is for example transparent values (pixels) for all areas where NDVI < 0. Is this possible?
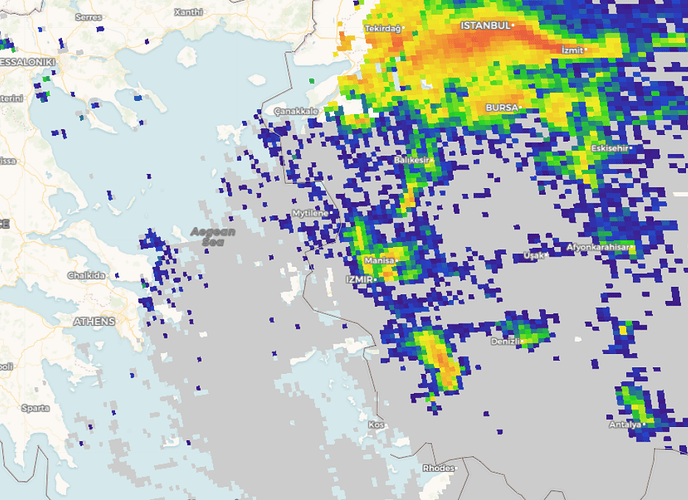
Similar to the ndvi for sentinel 5 I have tried this in EO-Browser:
var values = [ 31e-5, 51e-5, 7.51e-5, 11e-4, 2.51e-4, 51e-4]; //value of NO2 in mol/m2
pixel = [0.8, 0.8, 0.8, 0] // I would like to have these transparent instead of gray
if(NO2 >= 31e-5)
pixel = colorBlend(NO2, values,
[
[ 64/255, 27/255, 134/255], // → 3.01e-5 = #401B86
[ 37/255, 70/255, 201/255], // → 5.01e-5 = #2546C9
[ 42/255, 212/255, 36/255], // → 7.51e-5 = #2AD424
[240/255, 236/255, 37/255], // → 1.01e-4 = #F0EC25
[240/255, 117/255, 55/255], // → 2.51e-4 = #F07537
[219/255, 58/255, 76/255] // → 5.0*1e-4 = #DB3A4C
]);
return pixel;
So gray areas (which are actually values below the limit) should be transparent instead of gray.
Thanks
I do not believe this will work in Sentinel-5P. The transparency is already used for pixels with QA<0.75 or for no data values.
You might be able to get what you want with PROCESS API but we have not yet given it a try.
