I compared Sentinel-2 Band-8 from Copernicus scihub and from visualize analytical. The pixel values are different from these two sources. Ex. 0.27 in visualize analytical but 0.36 in Copernicus scihub. Any explanation could be?
I understand that visualize analytical did some Geo transformation, but I think the difference cannot that much.
Thanks a lot for your reply. The raw data is Sentinel-2 L2A 2022-8-14 34VCM. I checked Band 8 (10 m) at location 17.48382E 60.08970N. I got 0.1669 from Visualize Analytical tool but 2958 (0.2958) from Copernicus scihub.
I will investigate further into this, but there could be several explanations that may not be easily solved! A similar question was actually asked earlier this year in which my colleague Daniel Thiex wrote an excellent and detailed explanation to the discrepencies between Scihub and EO Browser data. You can read it here
Thank you very much for your time on my question and for providing helpful information.
Daniel Thiex gave the following four possible reseasons:
different projection system: this leads to a slight shift of the pixel location so when inspecting pixel values it might happen that you are comparing not the same pixel and thus gettig different results
if you use the default download for raw bands in EOB you download reflectance values and not digital numbers as from scihub ( DN = 10000 * REFLECTANCE). You can download values as DN by specifing the source format in an evalscript (more info here )
different in atmospheric correction: No the data is the same as the one on Scihub.
depending on the resolution you download there is of course a resampling done, which can also lead to slight differences in the values.
Then I tried the same location from my previous reply but on L1C data.
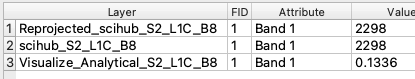
The difference in reflectance from different projection systems is very minor, which is no difference or less than 0.01 difference. (Ex. row 1 and 2 in the following table)
DN value should be divided by 10000 to convert to reflectance, which is just data conversion but not makes large differences.
This time I tried L1C data, so there are no atmospheric correction effects.
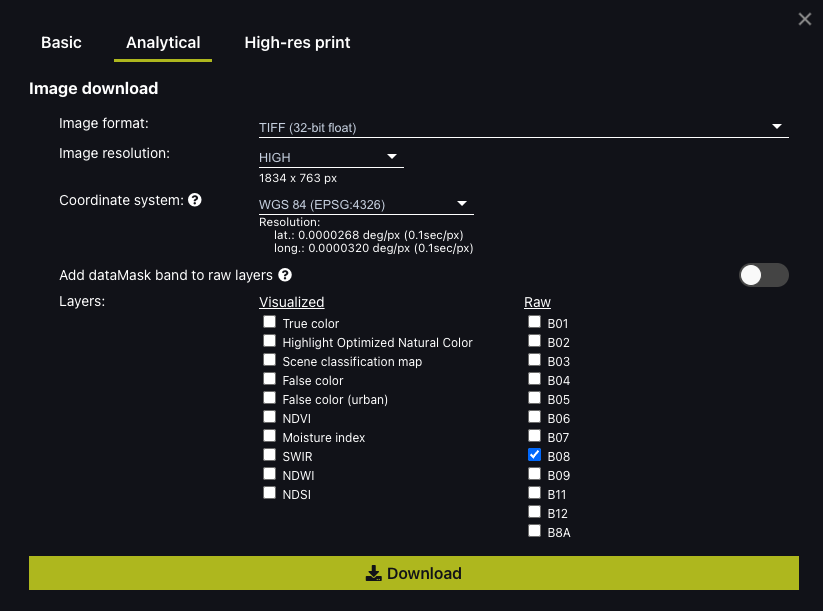
I selected the highest resolution in Visualize Analytical tool then the spatial resolution of TIFF image is around 3 to 4 meters. And the reflectance of B8 (NIR) from Visualize Analytical tool is always around 0.1 lower than the data from scihub. This bias exists in all bands and is very large, especially if we use this in the time series analysis of the vegetation index. (Ex. row 2 and 3 in the following table)
I was wondering if there is a way to get a clip image from the Visualize Analytical tool with identical reflectance data from the scihub?
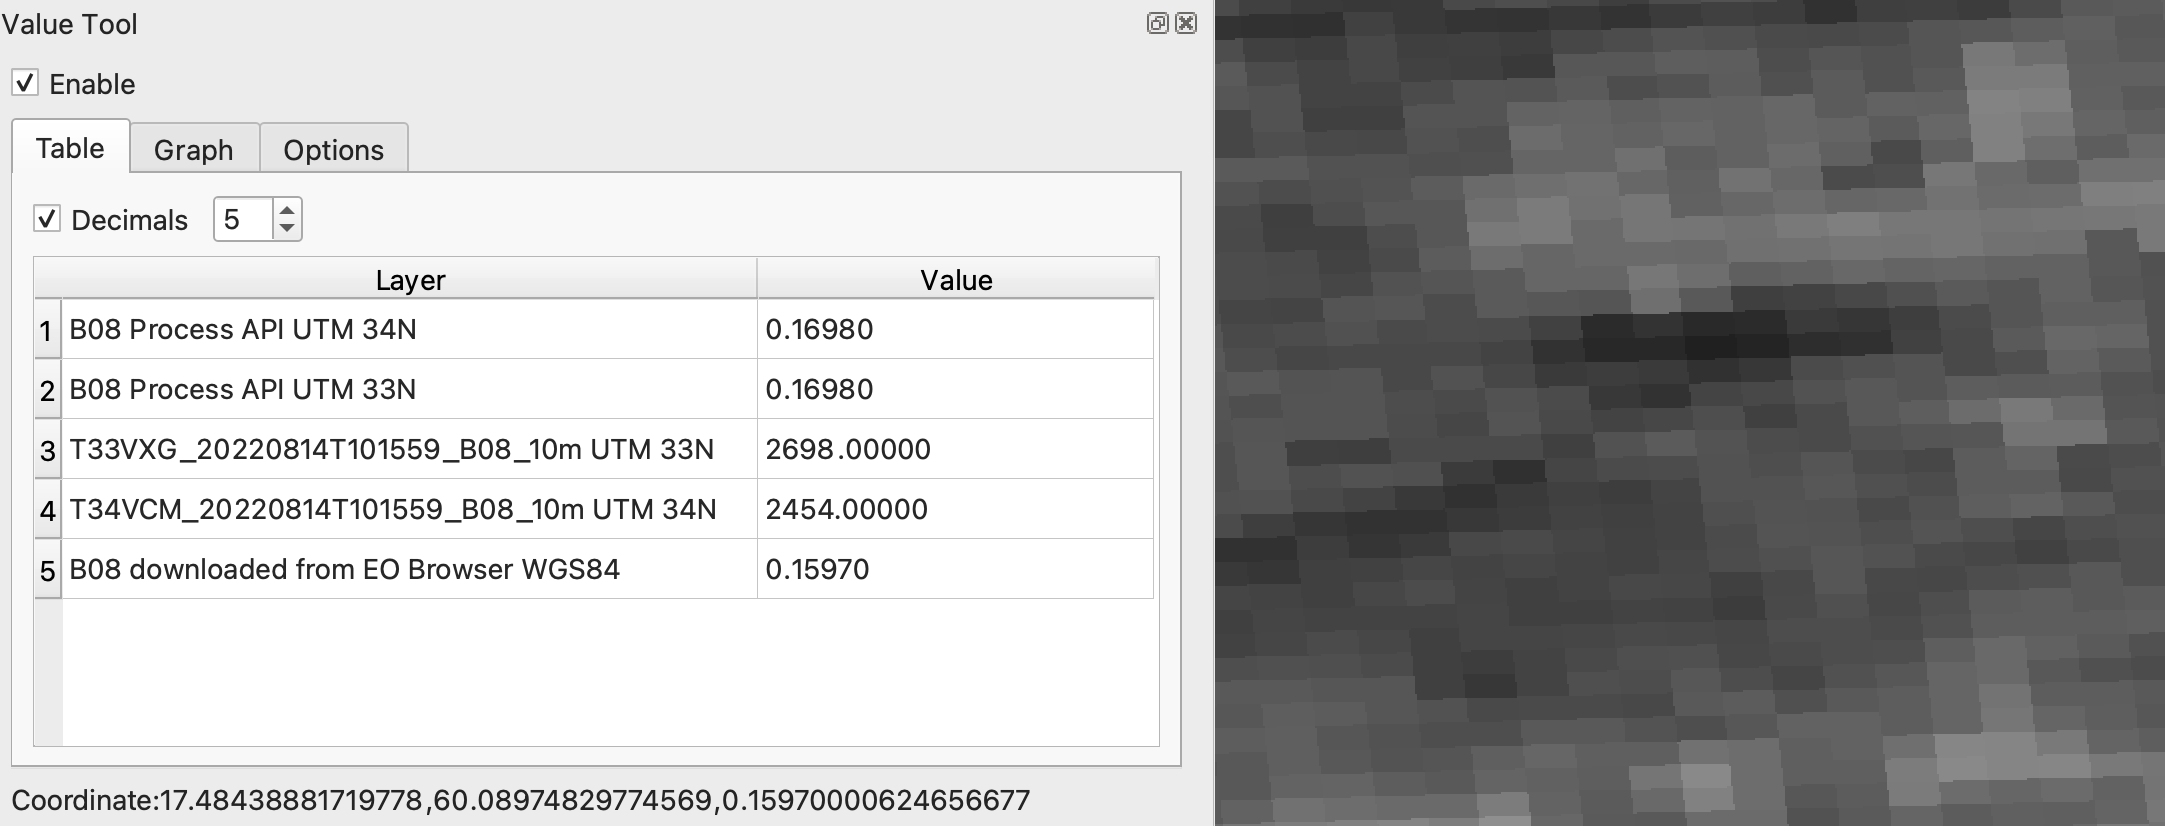
I looked in more detail at the area of interest. I downloaded the B08 from EO Browser and also from Scihub too. There are actually two tiles that can be downloaded over this area of interest. One is in UTM zone 33N and the other UTM zone 34N. In addition, I downloaded the data using Sentinel Hub’s Process API in those projections to compare the values. All the data downloaded was L2A. The results of which are below:
So yes, there is a difference between the Scihub and the data from Sentinel Hub in this instance. I would recommend downloading the data in UINT16 which is the native Sample Type for Sentinel-2 L2A data. You can read more about that here.
In addition, I would recommend also reading this blog post by my colleague, Maxim Lamare which explains the importance of Sample Types.
Lastly, instead of EO Browser, have you thought of using Sentinel Hub Process API to fetch your data? You can do this programatically with Python or in Request Builder. Here you will be able to specify the same projection as the Scihub data.
I will continue to investigate and see if we can find a solution for you.