I have downloaded the same S1 image twice:
one time from the AWS S1 bucket using aws s3 cp --request-payer requester s3://sentinel-s1-l1c/GRD/2024/6/14/IW/DV/S1A_IW_GRDH_1SDV_20240614T230644_20240614T230709_054326_069BDD_C14B/ ./S1/S1A_IW_GRDH_1SDV_20240614T230644_20240614T230709_054326_069BDD_C14B --recursive
and another using SentinelHub and got S1A_IW_GRDH_1SDV_20240614T230644_20240614T230709_054326_069BDD_C14B.SAFE
the folders hierarchy looks the same, there is an additional productInfo.json in the AWS version that seems to contain mapping between its file names and the SAFE version.
Unfortunately the only difference in the contents of the folders is in the images themselves which are located in the measurement folder.
It seems that the dynamic range of the SAFE format is larger than the AWS data:
For VV 0-11252 Vs. 25-1031
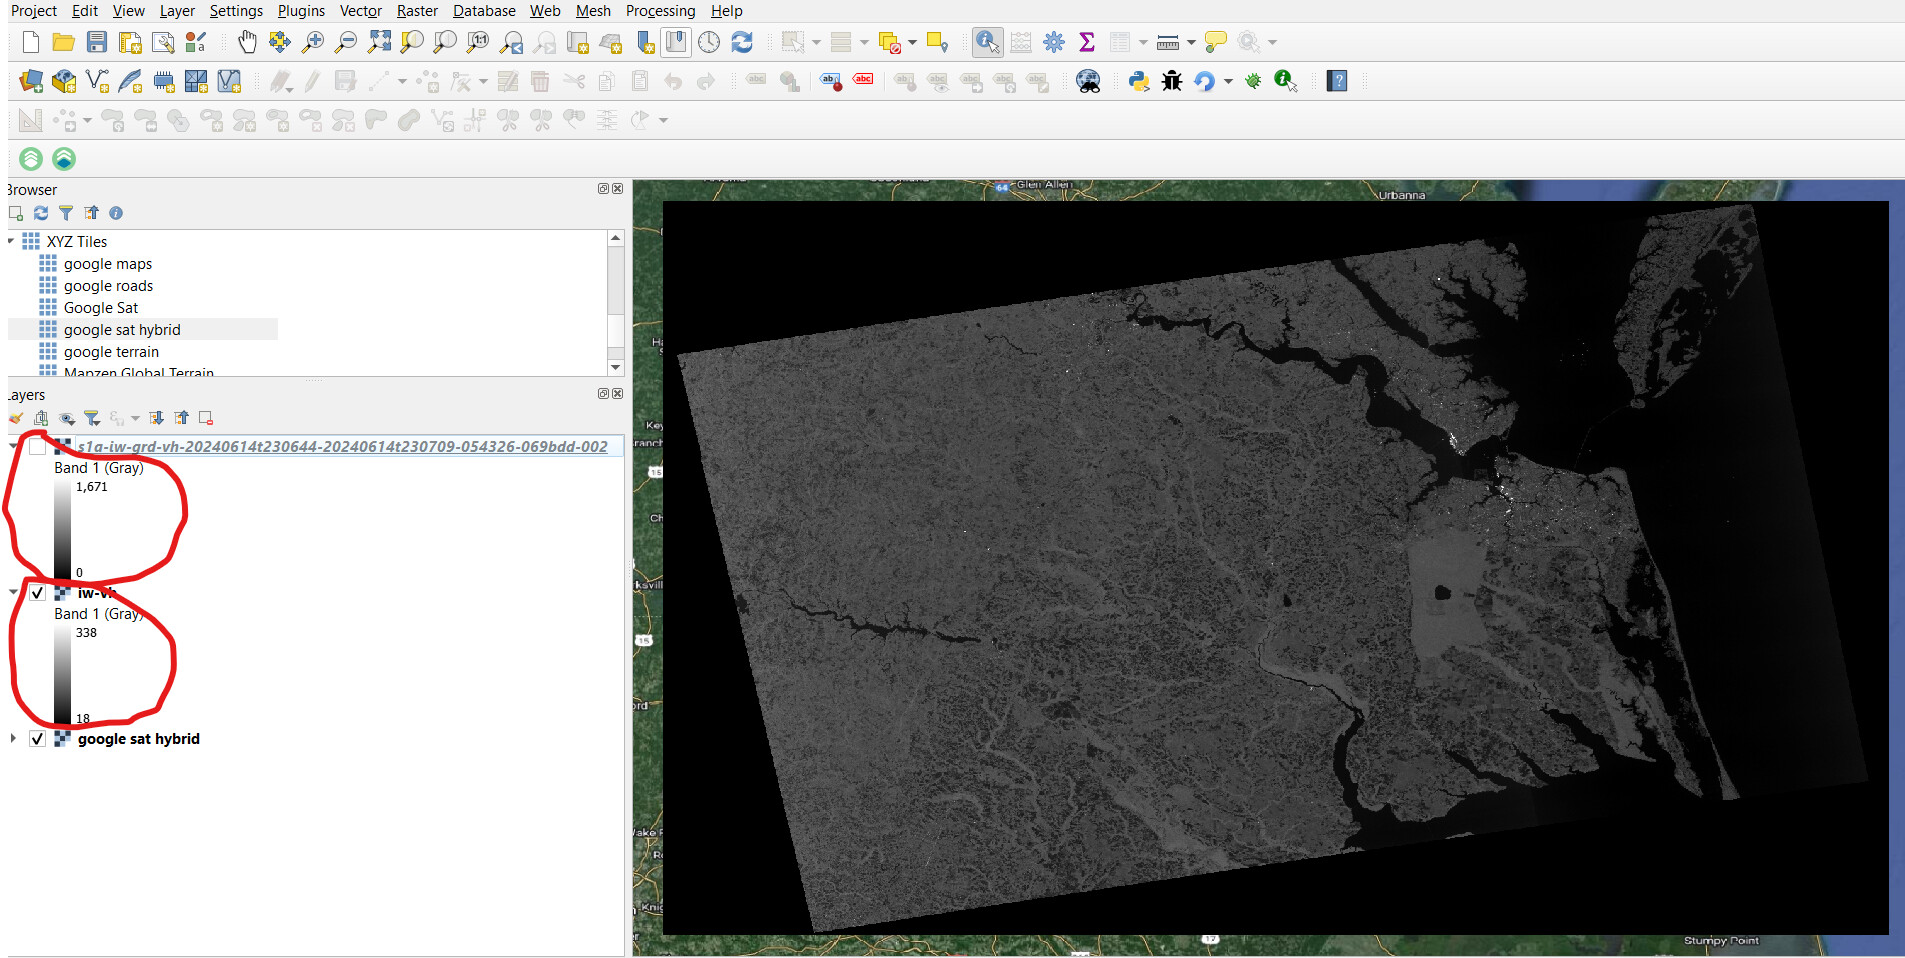
For VH 0-1671 Vs. 18-338
Anyone knows what is the origin of this difference (which seems to be the only one) between the data stored in AWS and the SAFE format? What kind of transformation applied here?
I assume you are using the S3 functions that are part of the Sentinel Hub Python package? This functionality is no longer maintained but there should not be a difference as they come from the same place.
How is the dynamic range calculated, it’s not clear how this was calculated?
Thank you William.
I didn’t apply any functions to the images whatsoever.
I just opened both of them in QGIS, they both georeferenced perfectly.
The only difference is the dynamic range, by that I simply mean the minimal and maximal values of the images which seems to be different.
OK so how did you use Sentinel Hub to download the image, Sentinel Hub APIs do not return the SAFE format, so can you be clear in what method you used to download the images using Sentinel Hub.
In addition, can you expand on the differences, and show me how you calculate the minimal and maximal values; e.g. I know that by default QGIS will exclude the most extreme values by default. How do the values differ on a pixel level?
The SAFE zip was downloaded via Alaska Satellite Facility which if I understand is identical to Sentinel’s Hub data and simply aligned with the SAFE format.
When opened in QGIS the default behavior is stretching to the min/max values without any truncation. attached is a screen shot which depicts the extrema values.
As I asked, please can you tell me how you downloaded the image from Sentinel Hub? We don’t provide data in SAFE format via our APIs so I am confused by what you mean by Sentinel Hub data.
Yes, I understand you are comparing to the ASF data. However, using Sentinel Hub APIs, you can output the data in a variety of different ways. For example, by default, the returned data is unitless (Linear power in the chosen backscatter coefficient (unitless), but you can also convert to decibels in your request too.
This is why I am interested in how you are requesting the data from Sentinel Hub.
The data in Sentinel Hub has been converted to cloud-optimised GeoTIFF format, in addition, some processing steps have been done as described here. I’m not familiar enough with the ASF data, so you would need to check with them if they have also implemented any processing steps.