Hi,
I am beginning to use the scihub copernicus api to gather image.
I found that there is a difference in color for a same image as seens directly on EO browser and the one that is downloaded using the provided scihub copernicus link.
When I extract the TCI image from the downloaded archive, the image is not as saturated as the one seen in EO Browser and the hue seems also different. Is there a processing on tiles showed directly on EO Browser web interface ?
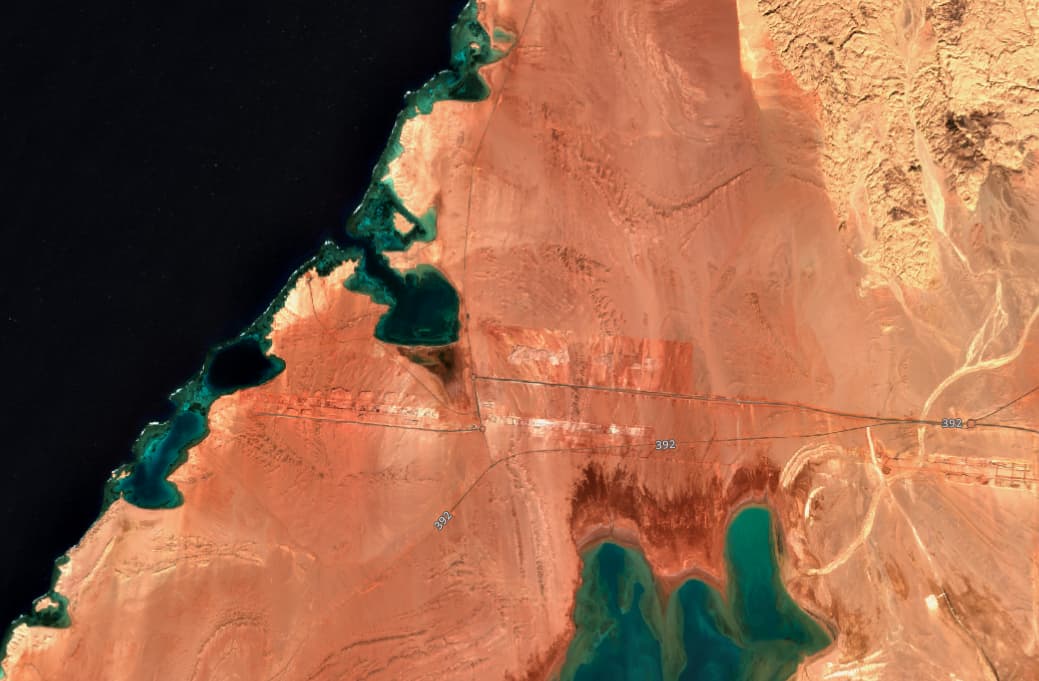
Here is the image directly from EO Browser :
Sentinel-2 L2A
2022-11-01
08:32:19 UTC
7.7% cloud coverage
Tile 36RXS
And here is the image from the downloaded archive :
The file name is : T36RXS_20221101T082111_TCI_10m.jp2 (the date is ok but the time seems to be different from the one shown in EO Browser which is 08:32:19 UTC
Why is there such a difference (exposure, hue, contrast) between the tile available directly on EO Browser and the one that can be downloaded through the link ?
The image that we get using scihub copernicus api are the one from the archive, and even if they are well defined at 10m, the colors are too bright to be usable. I was wondering why it was so different from what we see inside EO Browser web page.
It might be a dum question, but I am quite new to this, sorry if it’s obvious.
The reason for the difference between the EO Browser and the Copernicus SciHub images in this case is that the data you downloaded from the EOB is not raw, as is the case with the SciHub data.
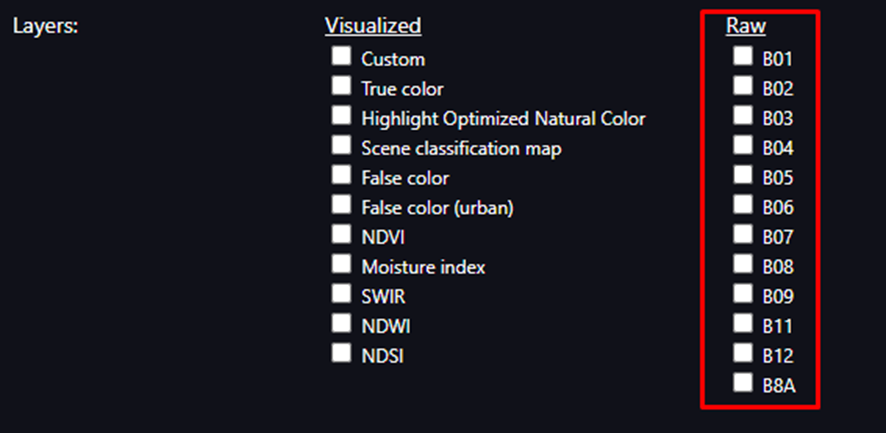
How the satellite data is processed by Sentinel Hub and what values the service should return is defined in the evalscript (or “custom script”). You can find the evalscripts for each of the S2-L2A layers by clicking on “Show evalscript” under the Visualize tab.
If you want to download the raw data (as in SciHub) from the EOB, you will need to download it in the Analytical tab by selecting the Raw bands. To access the Analytical tab, you need to be logged in. You can create a free account here.
So if I understand well, if I want the same render as in EO browser (with image from Scihub), I need to apply the same processing/stacking of band layer as the one shown in the evalscript using the raw data layers from scihub?