Differences in S2 L2A Reflection band data from API and Copernicus

I am trying to verify the data which I am downloading from this Sentinel-2 API service with the data I can manually download/process with Copernicus (https://scihub.copernicus.eu/dhus/#/home), and seeing a significant difference in the reflectance data for the same location between these two data sources.

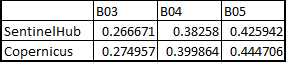
For example, if I access the spectral band reflectance for the same bbox location coordinates for the same productid (date & time) from these two sources for the Sentinel-2 L2A dataset, I get the following average reflectance values for bands 3, 4 and 5:
image

Has anyone else experienced a similar issue?

I have tried adjusting/correcting the following parameters in my request, but this has not made a measurable difference:

  • Orbit - confirmed that both datasets are using the same relative orbit number
  • harmonizeValues
  • mosaickingOrder
  • upsampling/downsampling

I am wondering at this point if there is an instrument response function/correction factor which could be being applied to either the SentinelHub or Copernicus data, but trying to validate this is proving very challenging.

Any advice or tips would be greatly appreciated.

Hi @natalie.mica ,

Could you please provide the product id and the request you use to get the result table mentioned in your post?

Hi @chung.horng ,

The productid is: S2A_MSIL2A_20221211T082341_N0509_R121_T36RVN_20221211T115856

The json for the post I made for the SentinelHub API is:

data = {
    "input": {
        "bounds": {
        "bbox": [
            32.61475,
            24.54875,
            32.61525,
            24.54925
        ]
        },
        "data": [
        {
            "dataFilter": {
                "timeRange": {
                    "from": "2022-12-11T08:23:00Z", 
                    "to": "2022-12-11T11:58:59Z"
                }
            },
            "type": "sentinel-2-l2a",
            "processing": {
                "harmonizeValues": "true"
            }
        }
        ]
    },
    "output": {
        "width": 50,
        "height": 50,
        "responses": [
        {
            "identifier": "default",
            "format": {
            "type": "image/tiff"
            }
        }
        ]
    },
    "evalscript": """
    //VERSION=3
        function setup() {
            return {
                input: [{
                    bands:["B01","B02","B03","B04","B05","B06","B07","B08","B8A","B09","B11","B12","SCL"],
                    units:[\"REFLECTANCE\",\"REFLECTANCE\",\"REFLECTANCE\",\"REFLECTANCE\",\"REFLECTANCE\",\"REFLECTANCE\",\"REFLECTANCE\",\"REFLECTANCE\",\"REFLECTANCE\",\"REFLECTANCE\",\"REFLECTANCE\",\"REFLECTANCE\",\"DN\"]
                }],
                output:[{
                    id: "default",
                    bands: 3,
                    sampleType: SampleType.UINT8
                }]
            };
        }
        function evaluatePixel(sample) {
            if ([2,4,5].includes(sample.SCL) ) { 
                return [sample.B03*255.0,sample.B04*255.0,sample.B05*255.0]
            }
        }
"""
    }

I then write the result of the post to a tiff file, and use the Python Image library and numpy to read the values from the pixels in the tiff file to get the averages which I printed above.

Hi @natalie.mica ,

There are a few points in your request which could cause the difference:

  • harmonizeValues is set to true. This is the default option to harmonize value so the data would be comparable to the data before Sentinel-2 processing baseline update (see more info here). To request the original data, please set the harmonizeValues to false.
  • height & width are set to 50. This results a ~1m resolution of your tiff, which is not the original resolution of Sentinel-2. The data will be different due to resampling.
  • The request is in wgs84. The original Sentinel-2 data is distributed in UTM as Sentinel-2 UTM tiles. Requesting in wgs84 will involve re-projection which can lead to difference.

Hi @chung.horng ,

Thank you for the suggestions.

I tried adjusting the harmonizeValues to false, and this made no impact on the average values for the bands.

As well, I adjusted the number of pixels in the final TIFF file to have 10 m or 60 m resolution (the minimum and maximum resolution for the spectral bands) and also played around with different upsampling and downsampling settings. Unfortunately these changes did not bring the average band values closer to what we calculated from the Copernicus dataset, and the changes were overall relatively small in magnitude.

The same is also true if I change the assessed coordinates to UTM instead of wgs84. This made a minor adjustment to the values, but did not bring it closer to the Copernicus dataset.

Is there anything else that I could try?

Hi @natalie.mica ,

I make a request to get the exact same data as the source data from Copernicus. You need to do the followings:

  • Align your bounding box to the Sentinel-2 tiling grid
  • Select the exact tile you are interested in using mosaicking: "TILE" in the evalscript
  • Set the input units to DN as the source
  • Set the output sampleType to UINT16
  • Set harmonizeValues to false

Below is the example request:

curl -X POST https://services.sentinel-hub.com/api/v1/process \
 -H 'Content-Type: application/json' \
 -H 'Authorization: Bearer ' \
 -d '{
  "input": {
    "bounds": {
      "bbox": [
        400560,
        2690820,
        509160,
        2799420
      ],
      "properties": {
        "crs": "http://www.opengis.net/def/crs/EPSG/0/32636"
      }
    },
    "data": [
      {
        "dataFilter": {
          "timeRange": {
            "from": "2022-12-11T00:00:00Z",
            "to": "2022-12-11T23:59:59Z"
          }
        },
        "processing": {
          "harmonizeValues": false
        },
        "type": "sentinel-2-l2a"
      }
    ]
  },
  "output": {
    "resx": 60,
    "resy": 60,
    "responses": [
      {
        "identifier": "default",
        "format": {
          "type": "image/tiff"
        }
      }
    ]
  },
  "evalscript": "//VERSION=3\n\nfunction setup() {\n  return {\n    input: [{bands: [\"B01\"], units: \"DN\"}],\n    output: { bands: 1, sampleType: \"UINT16\" },\n    mosaicking: \"TILE\"\n  };\n}\n\nfunction evaluatePixel(samples, scenes) {\n  let target_tile_idx;\n  for (let i = 0; i < samples.length; i++) {\n    if (scenes[i].productId === \"S2A_MSIL2A_20221211T082341_N0509_R121_T36RVN_20221211T115856\") {\n      target_tile_idx = i\n    }\n  }\n  return [samples[target_tile_idx].B01];\n}"
}'

Just to provide more information, using the json in the above message this is the comparative average reflectance values for each band from Copernicus (scihub.copernicus.eu) and SentinelHub:

Where the factor is the ratio between the SentinelHub and Copernicus values.

As shown above, this factor is typically between 95-97% with exception for band 02 where the SentinelHub reflectance is higher.

Are these two databases accessing and processing the data in identical ways? Or is it possible that one is performing more corrections (spectral, for example)?

Hi @natalie.mica ,

What is the exact request that produces the difference? Please try the latest example request which should give you the exact same data as data downloaded from Copernicus scihub.

Hi @chung.horng

Thank you for sending this suggestion. If you change the bounding box of this request to just a small area of 60 x 60 m2, is it possible for you to get an identical value compared to Copernicus?

My goal here is to download only the data I require for a particular location, rather than the entirety of a full Sentinel-2 tile.

If the projection between viewing a full tile in UTM to just a small area of 60 x 60 m2 is what is causing the difference here, as I feel we have eliminated many of the other likely possibilities, is it possible to figure out what mathematical formula to apply to the reflectance data to resolve this difference?

Hi @natalie.mica ,

As I mentioned in the previous post, you need to align:

  • Align your bounding box to the Sentinel-2 tiling grid
  • Select the exact tile you are interested in using mosaicking: "TILE" in the evalscript
  • Set the input units to DN as the source
  • Set the output sampleType to UINT16
  • Set harmonizeValues to false

I also provided an example request which does the above. It returns the exact same data as distributed by Copernicus Scihub. If possible please attach your request which creates the difference and the original product to which you are comparing, so I can pin down the issue for you. (the request you provided in previous post won’t get you the exact same data as the original product).

Last but not least, at this moment I think it is important to tell you too that the Copernicus Scihub is being replaced by the Copernicus Data Space Ecosystem in the near future and Sentinel Hub is one of the official APIs in the framework! It maybe better to build your functions around this service instead.

This topic was automatically closed 60 days after the last reply. New replies are no longer allowed.