Different color palette for NDVI image on Leaflet map

Hi everyone!
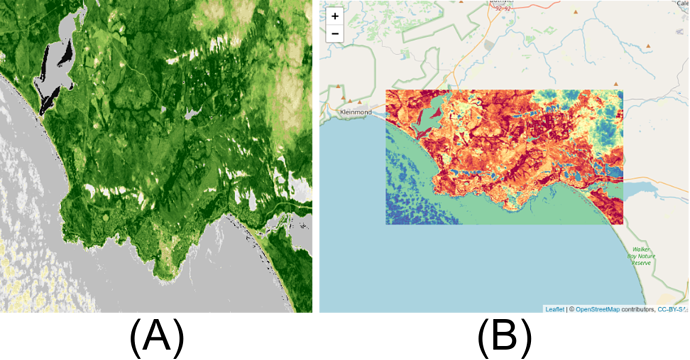
I have begun to work with your services recently and one point makes me baffled because I can’t understand why it happens. The color on the leaflet map is different from the color of the original image.
I suppose it is problem with Leaflet but maybe somebody knows the solution

It’s an image that I receive from sentinel (A)

And when I try to visualize it on leaflet map using this code.

r <- raster::raster("~/response_JPEG.png")

val <- c(19.06162, 19.34916, -34.45179, -34.31693)
crs(r) <- "+proj=longlat +datum=WGS84 +no_defs +ellps=WGS84 +towgs84=0,0,0" 
im <- raster::setExtent(r,val)
leaflet() %>% addTiles() %>% addRasterImage(im)

It gives me this map that has a color different from the color on the original image - (B)

I will appreciate any help from your side!

Hello,

Would you mind sharing the Evalscript you’re using for this request?

Best regards
Pontus

Hello!

There is my evalscript

//VERSION=3
function setup() {
  return {
    input: [{
      bands:["B04", "B05"],
    }],
    output: {
      id: "default",
      bands: 3,
    }
  }
}
function evaluatePixel(sample) {
    let ndvi = (sample.B05 - sample.B04) / (sample.B05 + sample.B04)
    
    if (ndvi<-0.5) return [0.05,0.05,0.05]
    else if (ndvi<-0.2) return [0.75,0.75,0.75]
    else if (ndvi<-0.1) return [0.86,0.86,0.86]
    else if (ndvi<0) return [0.92,0.92,0.92]
    else if (ndvi<0.025) return [1,0.98,0.8]
    else if (ndvi<0.05) return [0.93,0.91,0.71]
    else if (ndvi<0.075) return [0.87,0.85,0.61]
    else if (ndvi<0.1) return [0.8,0.78,0.51]
    else if (ndvi<0.125) return [0.74,0.72,0.42]
    else if (ndvi<0.15) return [0.69,0.76,0.38]
    else if (ndvi<0.175) return [0.64,0.8,0.35]
    else if (ndvi<0.2) return [0.57,0.75,0.32]
    else if (ndvi<0.25) return [0.5,0.7,0.28]
    else if (ndvi<0.3) return [0.44,0.64,0.25]
    else if (ndvi<0.35) return [0.38,0.59,0.21]
    else if (ndvi<0.4) return [0.31,0.54,0.18]
    else if (ndvi<0.45) return [0.25,0.49,0.14]
    else if (ndvi<0.5) return [0.19,0.43,0.11]
    else if (ndvi<0.55) return [0.13,0.38,0.07]
    else if (ndvi<0.6) return [0.06,0.33,0.04]
    else return [0,0.27,0]
}

Also there is request

{
    "input": {
        "bounds": {
            "properties": {
                "crs": "http://www.opengis.net/def/crs/OGC/1.3/CRS84"
            },
            "bbox": [
                19.06162,
                -34.45179,
                19.34916,
                -34.31693
            ]
        },
        "data": [
            {
                "type": "landsat-8-l1c",
                "dataFilter": {
                    "timeRange": {
                        "from": "2021-04-01T00:00:00Z",
                        "to": "2021-04-30T23:59:59Z"
                    }
                }
            }
        ]
    },
    "output": {
        "width": 512,
        "height": 512,
        "responses": [
            {
                "identifier": "default",
                "format": {
                    "type": "image/png",
                    "quality": 90
                }
            }
        ]
    }
} 
Hello,

I believe this issue could be because the way you use Leaflet doesn’t support RGB.

To get around this you can use a package called leafem. Your code would look something like this.

# Load image as a brick (https://www.rdocumentation.org/packages/raster/versions/3.4-13/topics/brick)
r <- brick("~/response_JPEG.png") 

val <- c(19.06162, 19.34916, -34.45179, -34.31693)
crs(r) <- "+proj=longlat +datum=WGS84 +no_defs +ellps=WGS84 +towgs84=0,0,0"
im <- raster::setExtent(r ,val) 

# addRasterRGB comes from the leafem library
leaflet() %>% addTiles() %>% addRasterRGB(im)

Let me know if you’d need any further help!

Best regards,
Pontus

1 Like

Thank you, it is not exactly a match, but now it looks much better, I will work on that!
EDIT: I’ve add quantiles = NULL in addRasterRGB and image is exactly the same as in original jpeg

Maybe you will be able to help me with another problem, how to add legend to this image, because I want to have a description which color corresponds which value?

It is possible. But you would have to convert the colors from your Evalscript to a legend manually. So it takes a little bit of time.

Let me know if you need any further help!

1 Like

It would be great if you could share any link where it is described.

It would help me a lot, thank you!