Hello,
I compared the mean and standard deviation for NDVI for specific polygon that I get for one specific polygon using 3 methods : using numpy, rasterstats and sentinel hub statistics API.For the numpy and rasterstats I have recieved same results but for sentinel hub API I have gotten different results and that made me very worried. I could not find any reason to that difference.
The image I have used is NDVI image that I have geenrated using sentinelhub evalscript. For the statistic API I have download the image but selected the same date.
Here are the main parts of the script:
ndvi_evalscript = """
//VERSION=3

function setup() {
  return {
    input: [
      {
        bands: [
          "B04",
          "B08",
          "dataMask"
        ]
      }
    ],
    output: [
      {
        id: "ndvi",
        bands: 1
      },
      {
        id: "dataMask",
        bands: 1
      }
    ]
  }
}

function evaluatePixel(samples) {
    return {
      ndvi: [index(samples.B08, samples.B04)],
      dataMask: [samples.dataMask]
    };
}
"""
#evaluate script to get NDVI images
evalscript='''
//VERSION=3
function setup() {
  return {
    input: ["B04", "B08", "CLM"],
    output: {
      bands: 1,
      sampleType: "FLOAT32"
    }
  };
}

function evaluatePixel(sample) {
    if (sample.CLM == 1) {
        return [null]
    }
    const ndvi = index(sample.B08, sample.B04);
    return [ndvi];
}
'''
The calculations.
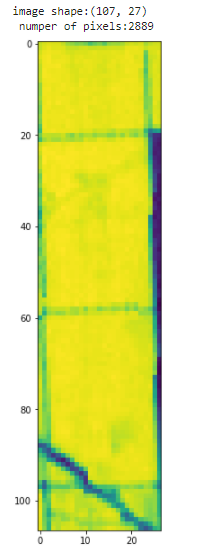
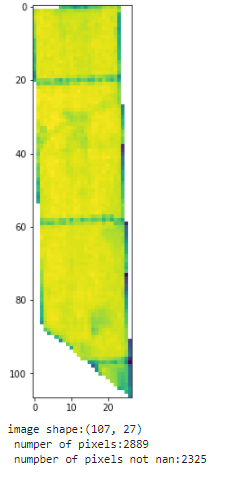
out_image is the image that I have download from sentinel hub, after clip it with the polygon to get only the pixels that are inside the polygon,so if the original image was this:
the clipped images was this:
#numpy
array=out_image[~np.isnan(out_image)]
mean=out_image[~np.isnan(out_image)].mean()
std=out_image[~np.isnan(out_image)].std()
print('Numpy Stats \n Mean:{} \n std:{} \n    '.format(out_image[~np.isnan(out_image)].mean(),out_image[~np.isnan(out_image)].std()))

#rasterstats
stats = zonal_stats(polygons,'imgs/weighted/uniformity/36/AL571418Z/c502542541d0cff0a483d4441656dac3/response.tiff',stats=['mean','std'])
print('Rasterstat Stats \n Mean:{} \n std:{} \n    '.format(stats[0]['mean'],stats[0]['std']))


#sentinel hub-
#editing my polygon layer (contain one polygon)- adding before and after date,though it is needed for one day

polygons['Date']=pd.to_datetime(polygons['Date'])
polygons['day_before']=(polygons['Date'] - timedelta(days=1)).astype(str)
polygons['day_after']=(polygons['Date'] + timedelta(days=1)).astype(str)

yearly_time_interval = polygons['day_before'].values[0], polygons['day_after'].values[0]

#making sure is geodataframe and changing the CRS
tmp1= gpd.GeoDataFrame(polygons, geometry=polygons['geometry'])
tmp1=tmp1.set_crs('epsg:4326')
tmp1=tmp1.to_crs('epsg:3857')


aggregation = SentinelHubStatistical.aggregation(
    evalscript=ndvi_evalscript,
    time_interval=yearly_time_interval,
    aggregation_interval='P1D',
    resolution=(10, 10)
)

input_data = SentinelHubStatistical.input_data(
    DataCollection.SENTINEL2_L2A
)

histogram_calculations = {
    "ndvi": {
        "histograms": {
            "default": {
                "nBins": 20,
                "lowEdge": -1.0,
                "highEdge": 1.0
            }
        }
    }
}

ndvi_requests = []

for geo_shape in tmp1.geometry.values:
    request = SentinelHubStatistical(
        aggregation=aggregation,
        input_data=[input_data],
        geometry=Geometry(geo_shape, crs=CRS(tmp1.crs)),
        calculations=histogram_calculations,
        config=config
    )
    ndvi_requests.append(request)


download_requests = [ndvi_request.download_list[0] for ndvi_request in ndvi_requests]

client = SentinelHubStatisticalDownloadClient(config=config)

ndvi_stats = client.download(download_requests)

len(ndvi_stats)


ndvi_dfs = [stats_to_df(polygon_stats) for polygon_stats in ndvi_stats]

for df, plotname in zip(ndvi_dfs, tmp1['Code'].values):
    df['Code'] = plotname

ndvi_df = pd.concat(ndvi_dfs)

print('Sentinel Hub Stats \n Mean:{} \n std:{} \n    '.format(ndvi_df['ndvi_B0_mean'].values[0],ndvi_df['ndvi_B0_stDev'].values[0]))
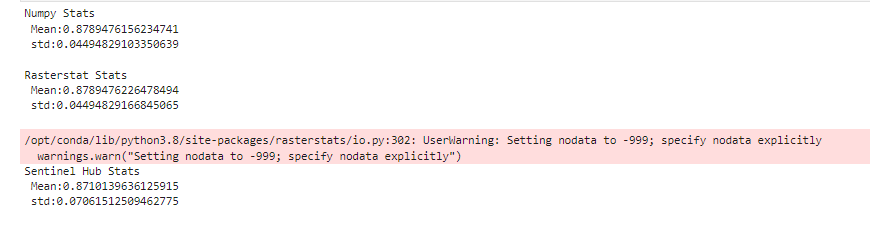
The print the following results:
The polygon
'POLYGON ((35.6612896979905 32.72962500529067, 35.66408235831306 32.72968974482684, 35.66408361517614 32.7296594252419, 35.66415217379804 32.72800677477335, 35.66415298465024 32.72798725371085, 35.66422358962961 32.72628520221435, 35.66447388568599 32.72025108550361, 35.66447794445177 32.72015322757203, 35.66447664775113 32.72015246949374, 35.66442681239299 32.72012330929595, 35.66384605281009 32.72045989519251, 35.66316257848069 32.72089408945062, 35.66284249701737 32.72108015441079, 35.66246977119408 32.72132009060678, 35.66192103493618 32.7216352219215, 35.66159147471999 32.7217419978754, 35.66159141728522 32.72174203054583, 35.66134397894427 32.72793002481657, 35.6613454747078 32.72793005543429, 35.66129164613404 32.72958571495224, 35.66129303265527 32.72958649257185, 35.66129160936744 32.72958645447603, 35.6612896979905 32.72962500529067))'
I don’t know if the issue relates to the nodata warning that was raised, but I was very worried about these differences, would like to get help to understand the difference and how that can be fixed.
Thanks in advance ![]()