Eo-Browser unit used in the composite of Sentinel-2/Level 2A

Hi

I’m a beginner. In Eo-Browser, I made a polygon, then used a composite of three bands, then I used the (Feature Info Service Chart) to download the data as csv (attached screenshot)

My question is what is the unit of the data? Is it a [DN] or a reflectance value? I used the website interface with only these mentioned steps without any extra code

Greetings

Dear @max.303

You can check the evalscript within the Custom script element to see what data is send to the statistics endpoint (statistical API). I also pasted it bellow. As you can see there, no unit is specified which means the default (reflectance) is returned. You can also see that the values returned where multiplied with 2.5.

//VERSION=3
function setup() {
  return {
    input: ["B04","B03","B02", "dataMask"],
    output: { bands: 4 }
  };
}

function evaluatePixel(sample) {
  
  return [2.5 * sample.B04, 2.5 * sample.B03, 2.5 * sample.B02, sample.dataMask];
}

If you want DN you can use this script as starting point. Just paste it in the custom script window and calculate the statistics (note that the visualization of this script will mainly be white on the map).

//VERSION=3
function setup() {
  return {
    input: [
      {
        bands: ["B01","B02","B03", "dataMask"],
        units: "DN",
      }
    ],
    output: [
      { 
        bands: 4
      }
    ]
  };
}

function evaluatePixel(sample) {
  
  return [sample.B01, sample.B02, sample.B03, sample.dataMask];
}

Best,
Daniel

If you have a Sentinel Hub account I also recommend you to check out our Request Builder that lets you send statistic request directly to the API.

1 Like

**Thank you Daniel for the fast answer with details. I need the reflectance value for my research, so I used the same default code and deleted the multiplication with (2.5) as following

//VERSION=3
function setup() {
  return {
    input: ["B01","B02","B03", "dataMask"],
    output: { bands: 4 }
  };
}

function evaluatePixel(sample) {
  
  return [sample.B01, sample.B02, sample.B03, sample.dataMask];
}

The expected value for this will be between 0 and 1. Nevertheless, I have values higher than one! See the attached image.
The link to the area of this figure is here
link to the area

. My question is; How it could be possible for the reflectance value to be higher than one.
Yours sincerely

Generally reflectance values are between 0 and 1, infact the typical range is (0 - 0.4)

However, It is also a common phenomena to have reflectance values of more than 1 especially over surfaces such as clouds, snow, and other bright surfaces such as glass etc. Infact we mention this in our documentation on Sentinel 2 L2A units.

If you would like to read more about the physics of such phenomena, check out this article among many other articles

I hope that helps

1 Like

Thank you @ dorothyrono
I read the link you sent, It was helpful.
Further I will use the next code to assure the reflectance as output of the code
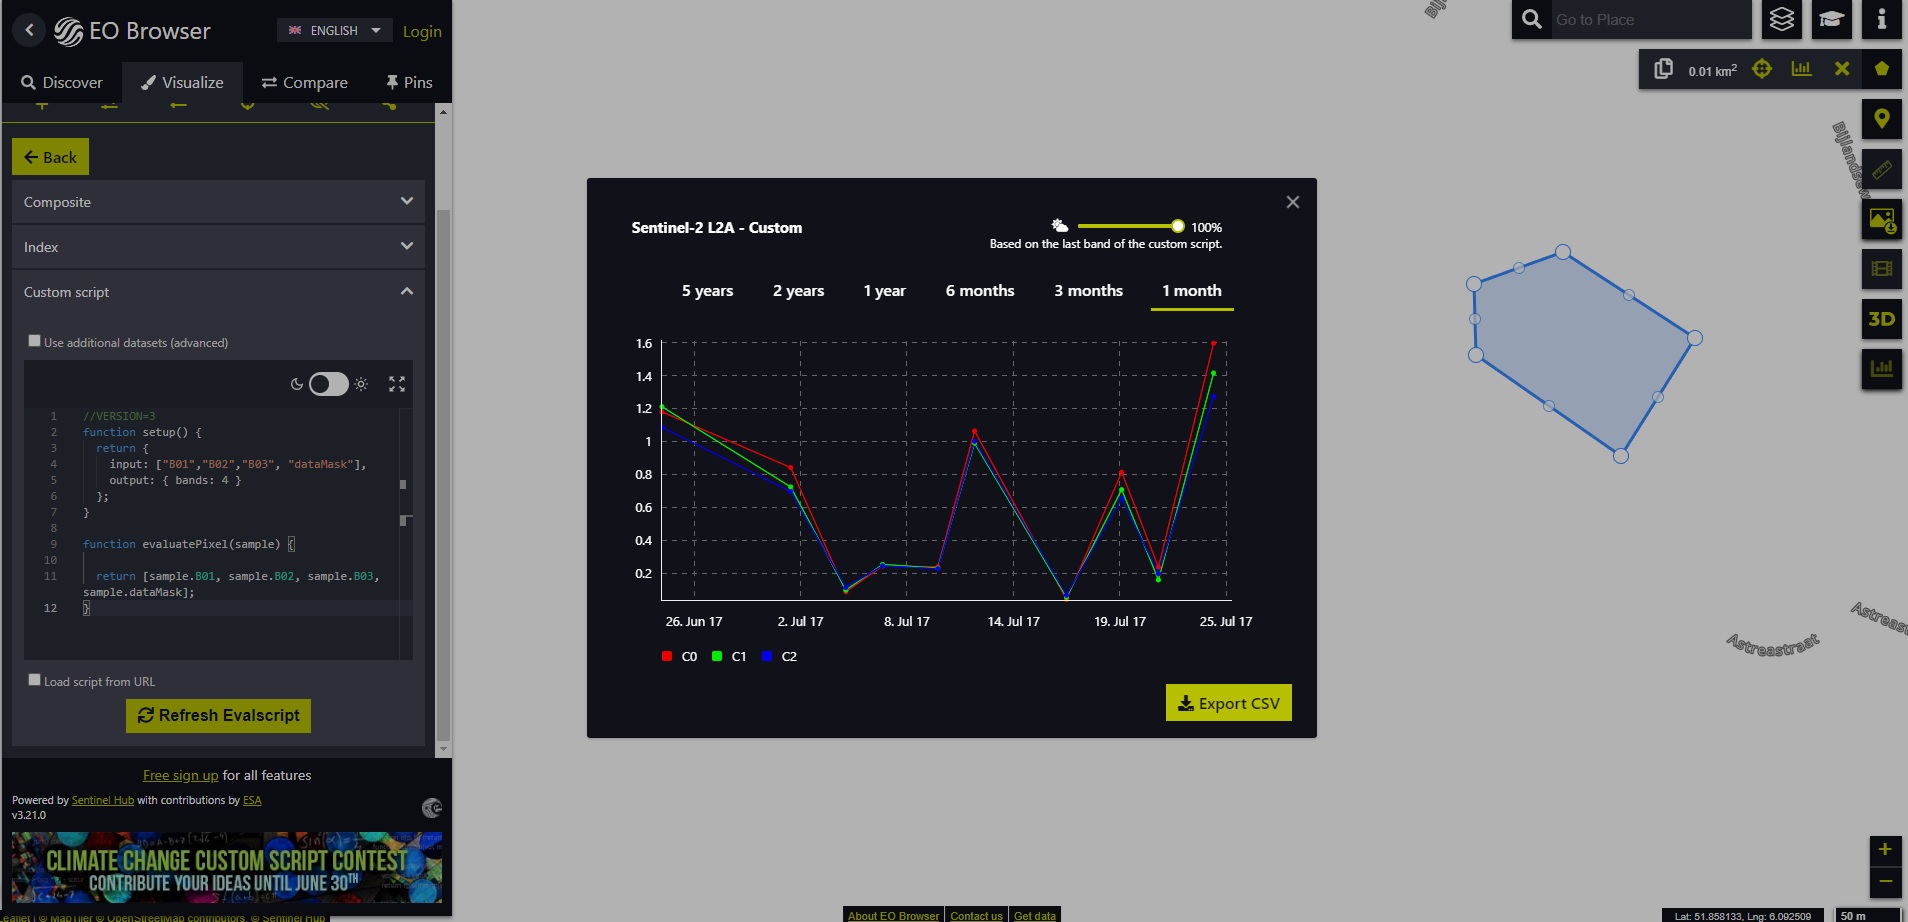
Making a polygon and running the code will result in a downloadable csv (using the Feature Info Service Chart tool).
The csv output have three issues:

1- The output gives the min, max, and the mean for every band. How could I add the Median? The Median could provide more statistical insight if the data skewed.

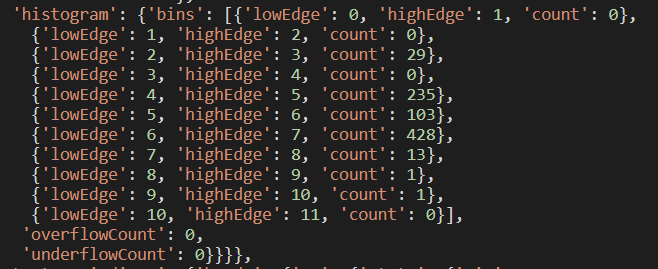
2- The output of SCL (Scene Classification Data) value will be the mean value as a number. For example, I will get the number 3 as an output because it is the mean. How could I obtain full data instead? I mean to get a result like this
33.3% of the pixels have the value of 1
33.3% of the pixels have the value of 3
33.3% of the pixels have the value of 5
And the mean is 3

3- There are three empty columns (C0/median, C0/p10, C0/p90) After each band. The bug is in the next column (C0/cloudCoveragePercent) which is always 100%. Is it a bug in the system that the cloud cover is always 100% for polygons?

//VERSION=3
function setup() {
  return {
    input: ["B01","B02","B03","B04","B05","B06","B07","B08","B8A","B09","B11","B12","SCL","CLP","CLM", "dataMask"], units: "Reflectance",
 
    output: { bands: 16, sampleType: "FLOAT32"  }
  };
}
 
function evaluatePixel(sample) {
  
  return [sample.B01, sample.B02, sample.B03, sample.B04, sample.B05,sample.B06,sample.B07, sample.B08, sample.B8A, sample.B09, sample.B11, sample.B12, sample.SCL, sample.CLP, sample.CLM, sample.dataMask];
}


sincerely

Let me answer your questions as follows:

  1. When you write a custom script on EO browser to request for statistics, EO Browser uses as indicated, Feature Info Service (FIS) which does not support median or percentiles. That is why (C0/median, C0/p10, C0/p90) are empty. However Statistical API which we developed as an improvement for FIS, has the capability to return percentiles (the 50th percentile should be the median), histogram and other more powerful functionalities.

  2. That is true, with SCL it is important to know the distribution of the different classes. To obtain that distribution you will need to use histogram bins, to get the count of the pixels falling within a certain bin. At the moment this is only supported by Statistical API as already mentioned in my first comment. Here is the documentation and examples regarding histogram. Here is an example of SCL histogram bins result;
    image

Is it a bug in the system that the cloud cover is always 100% for polygons?

The 100 % which is always returned is simply the default value. To get the correct cloud coverage percentage, the calculation needs to be done in the script. For example, in the code below, the SCL band is used to identify cloudy pixels, from which the percentage of cloudy pixels is calculated.

//VERSION=3

function setup() {

  return {

    input: [{

      bands: [

        "B01",

        "B02",

        "B03",

        "B04",

        "SCL"

      ]

    }],

    output: {

      bands: 5

    }

  }

}

function evaluatePixel(samples) {


    // If the pixel is cloudy return False

    var cloud = isCloud(samples.SCL)

  // If cloudy return Band1 + 2nd band with 1,

    // otherwise return Band1 + 2nd band with 0

    return cloud ? [samples.B01, samples.B02,samples.B03, samples.B04, 1] : [samples.B01, samples.B02,samples.B03, samples.B04, 0];

}

function isCloud (scl) {

  if (scl == 3) { // SC_CLOUD_SHADOW

    return false;

  } else if (scl == 9) { // SC_CLOUD_HIGH_PROBA

    return true; 

  } else if (scl == 8) { // SC_CLOUD_MEDIUM_PROBA

    return true;

  } else if (scl == 7) { // SC_CLOUD_LOW_PROBA

    return false;

  } else if (scl == 10) { // SC_THIN_CIRRUS

    return true;

  } else if (scl == 11) { // SC_SNOW_ICE

    return false;

  } else if (scl == 1) { // SC_SATURATED_DEFECTIVE

    return false;

  } else if (scl == 2) { // SC_DARK_FEATURE_SHADOW

     return false;

  }

  return false;

}

In general, for further analysis beyond (mean, min, max) I recommend using Statistical API.

I hope this is helpful

Best regards

1 Like

Thank you for the explanation. It’s helpful. I will switch to the Statistical API.
Best regards

1 Like