Hey @eddiemuhoro, thanks for reaching out. Apologies for the mix up, as @msterk mentioned, the band names were incorrect in the open data collection. This has been resolved now and you shouldn’t see this issue any more.
One other thing to note, this crop biomass open dataset is hosted in the US West region, and so you may need to adjust what end point you are using for Sentinel Hub APIs to use services-uswest2.sentinel-hub.com.
Here is a Python code sample that works with the Open Data collections
Python Code Sample
from sentinelhub import (
DataCollection,
SentinelHubDownloadClient,
SentinelHubStatistical,
SHConfig,
Geometry,
CRS
)
from shapely.geometry import shape
import pandas as pd
import json
# Provide credentials to connect to Sentinel Hub
# https://sentinelhub-py.readthedocs.io/en/latest/configure.html#environment-variables
config = SHConfig.load()
uswest_config = config
uswest_config.sh_base_url = "https://services-uswest2.sentinel-hub.com"
# Define your Sentinel Hub Collection
collection_id = "fc844940-ecc7-49ff-b072-9f81b36ef191" # Replace with a collection ID
data_collection = DataCollection.define_byoc(collection_id)
input_data = SentinelHubStatistical.input_data(data_collection)
area_of_interest = '''{
"type": "Polygon",
"coordinates": [
[
[
-10743613.707363,
4991187.393896
],
[
-10743613.707363,
4992276.731204
],
[
-10742541.14407,
4992276.731204
],
[
-10742541.14407,
4991187.393896
],
[
-10743613.707363,
4991187.393896
]
]
]
}'''
area_of_interest = shape(json.loads(area_of_interest))
# Specifiy your time of interest (TOI)
time_of_interest = "2020-01-01", "2021-01-01"
# Specify a resolution
resx = 100
resy = 100
# Provide an evalscript
#time_series_evalscript_path = "crop_biomass.js" #using the previous eval script
#with open(time_series_evalscript_path, 'r') as file:
# time_series_evalscript = file.read()
time_series_evalscript = '''
//VERSION=3
// To set custom max and min values, set
// defaultVis to false and choose your max and
// min values. The color map will then be scaled
// to those max and min values
function setup() {
return {
input: ["CB", "dataMask"],
output: [
{ id: "default", bands: 4 },
{ id: "index", bands: 1, sampleType: "FLOAT32" },
{ id: "eobrowserStats", bands: 1, sampleType: "FLOAT32" },
{ id: "dataMask", bands: 1 },
],
};
}
const bp_ramp = [
[0, 0xfff7ea],
[0.1, 0xf3e3c8],
[0.2, 0xdad0a4],
[0.3, 0xbdc082],
[0.4, 0x99b160],
[0.5, 0x6da242],
[0.6, 0x2c952e],
[0.7, 0x008729],
[0.8, 0x007932],
[0.9, 0x006640],
[1.0, 0x005444],
];
const visualizer = new ColorRampVisualizer(bp_ramp);
let factor = 1 / 1000;
function evaluatePixel(sample) {
let val = sample.CB * factor;
let imgVals = visualizer.process(val);
return {
default: [...imgVals, sample.dataMask],
index: [val],
eobrowserStats: [val],
dataMask: [sample.dataMask],
};
}'''
# Create the requests
aggregation = SentinelHubStatistical.aggregation(
evalscript=time_series_evalscript, time_interval=time_of_interest, aggregation_interval="P1D", resolution=(resx, resy)
)
request = SentinelHubStatistical(
aggregation=aggregation,
input_data=[input_data],
geometry=Geometry(area_of_interest, crs=CRS("EPSG:3857")),
config=uswest_config,
)
# Post the requests
download_requests = [request.download_list[0]]
client = SentinelHubDownloadClient(config=uswest_config)
stats_response = client.download(download_requests)
# Parse the repsonse
# Load into a pandas dataframe
series = pd.json_normalize(stats_response[0]["data"])
# Clean up columns in the dataframe by selecting ones to remove
del_cols = [i for i in list(series) if i not in ["interval.from",
"outputs.eobrowserStats.bands.B0.stats.min",
"outputs.eobrowserStats.bands.B0.stats.max",
"outputs.eobrowserStats.bands.B0.stats.mean"
]]
# Drop unused columns and rename remaining columns
series = series.drop(columns=del_cols).rename(columns={'interval.from': 'date',
'outputs.eobrowserStats.bands.B0.stats.min': 'minimum_cb',
'outputs.eobrowserStats.bands.B0.stats.max': 'maximum_cb',
'outputs.eobrowserStats.bands.B0.stats.mean':'mean_cb'
})
# Calculate new columns
series["mean_cb"] = series["mean_cb"].astype(float)
series["date"] = pd.to_datetime(series['date']).dt.date
series["day_of_year"] = series.apply(lambda row: row.date.timetuple().tm_yday, axis=1)
series["year"] = series.apply(lambda row: row.date.year, axis=1)
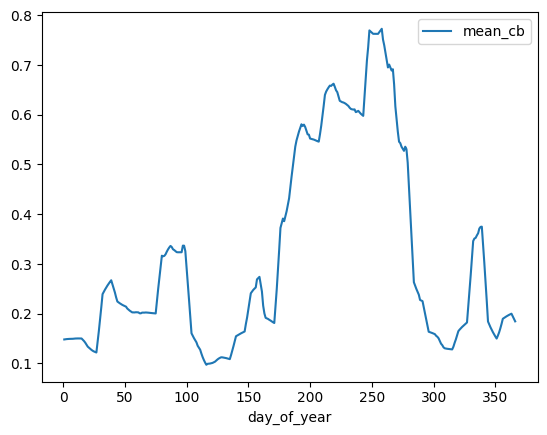
series.plot(x = "day_of_year", y = "mean_cb")