Respected Sir/Ma’am,
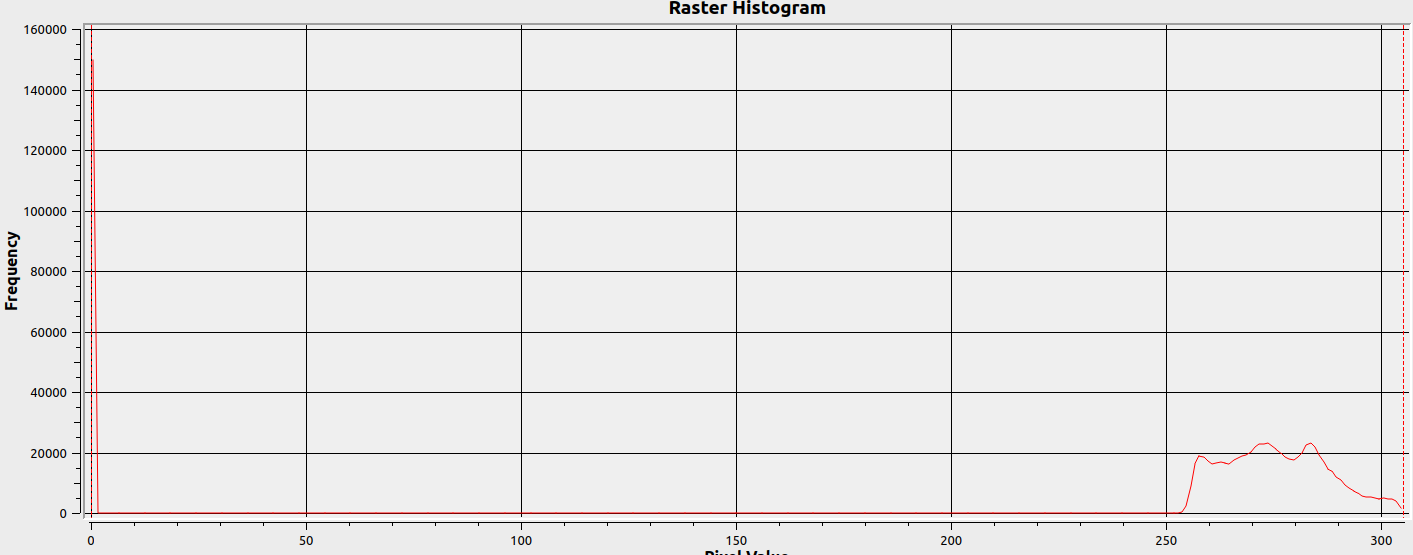
I am trying to download the LST band (anyone S7, S8, S9) from Sentinel S3SLSTR, but I made some changes in the script because while downloading the specific band the values were showing between 0-255. Here is the script I used and when opening the image in ArcPRO:
curl -X POST https://creodias.sentinel-hub.com/api/v1/process
-H ‘Content-Type: application/json’
-H ‘Authorization: Bearer my-token’
-d ‘{
“input”: {
“bounds”: {
“geometry”: {
“type”: “Polygon”,
“coordinates”: [
[
[
-155.63424,
67.028205
],
[
-160.262603,
66.237243
],
[
-160.40941,
64.221812
],
[
-161.20485,
63.093609
],
[
-161.663525,
61.498407
],
[
-140.734505,
61.705222
],
[
-140.431903,
68.596849
],
[
-155.806529,
68.108271
],
[
-155.63424,
67.028205
]
]
]
},
“properties”: {
“crs”: “http://www.opengis.net/def/crs/EPSG/0/4326”
}
},
“data”: [
{
“type”: “S3SLSTR”,
“dataFilter”: {
“timeRange”: {
“from”: “2018-05-01T00:00:00Z”,
“to”: “2018-05-01T23:59:59Z”
},
“maxCloudCoverage”: 4
}
}
]
},
“output”: {
“width”: 1122.8268621383063,
“height”: 790.1948375460967,
“responses”: [
{
“identifier”: “default”,
“format”: {
“type”: “image/tiff”
}
}
]
},
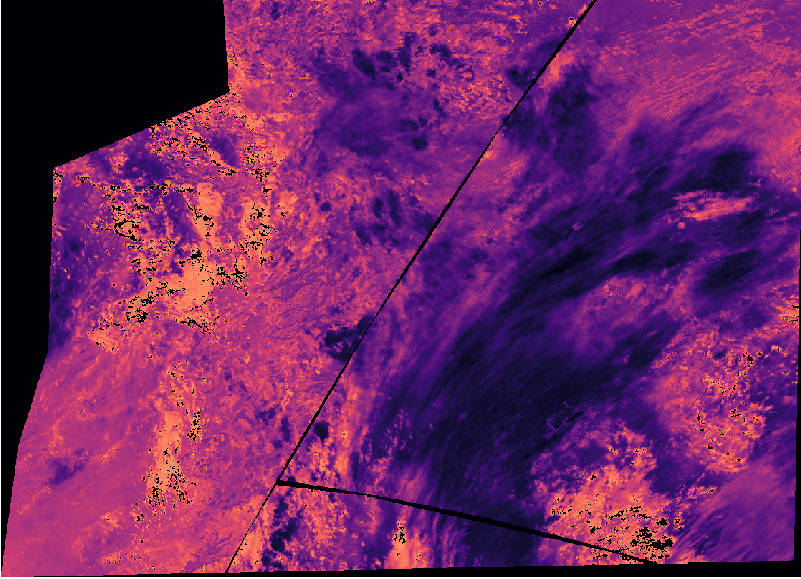
“evalscript”: "//VERSION=3 (auto-converted from 1)\nfunction setup() {\n return {\n input: [{\n bands: ["S7"]\n }],\n output: { \n bands: 1\n }\n }\n}\n// Create a Red gradient visualiser from 274-450 K\nvar viz = ColorGradientVisualizer.createRedTemperature(250,320)\nfunction evaluatePixel(sample) {\n return viz.process(sample.S7);\n}\n\n "
}’
THE EVALSCRIPT:
//VERSION=3 (auto-converted from 1)
function setup() {
return {
input: [{
bands: [“S7”]
}],
output: {
bands: 1
}
}
}
// Create a Red gradient visualiser from 274-450 K
var viz = ColorGradientVisualizer.createRedTemperature(250,320)
function evaluatePixel(sample) {
return viz.process(sample.S7);
}
AND THE OUTPUT:
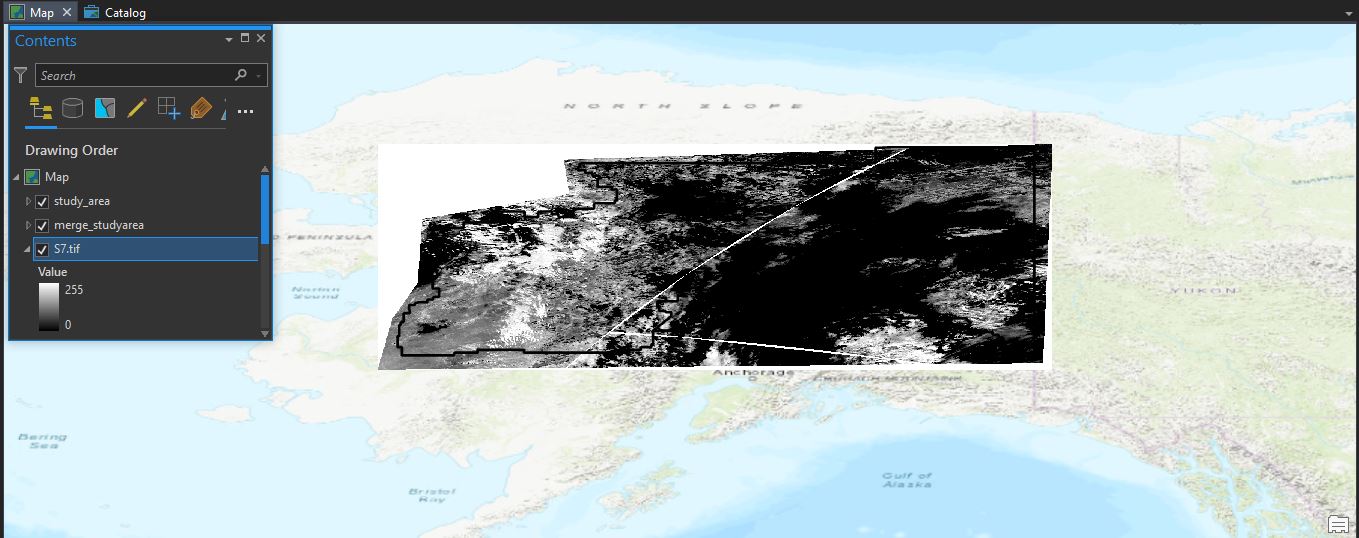
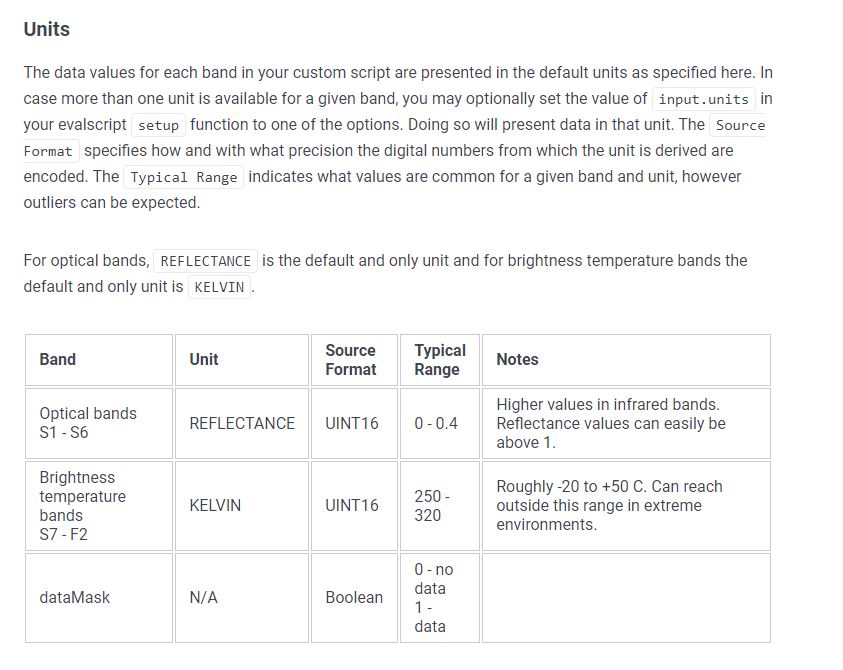
But I do not want pixel values between 0-255 rather in kelvin. So I inserted units in the eval script following this page:
So now my script changed to this:
curl -X POST https://creodias.sentinel-hub.com/api/v1/process
-H ‘Content-Type: application/json’
-H ‘Authorization: Bearer my-token’
-d ‘{
“input”: {
“bounds”: {
“geometry”: {
“type”: “Polygon”,
“coordinates”: [
[
[
-155.63424,
67.028205
],
[
-160.262603,
66.237243
],
[
-160.40941,
64.221812
],
[
-161.20485,
63.093609
],
[
-161.663525,
61.498407
],
[
-140.734505,
61.705222
],
[
-140.431903,
68.596849
],
[
-155.806529,
68.108271
],
[
-155.63424,
67.028205
]
]
]
},
“properties”: {
“crs”: “http://www.opengis.net/def/crs/EPSG/0/4326”
}
},
“data”: [
{
“type”: “S3SLSTR”,
“dataFilter”: {
“timeRange”: {
“from”: “2018-05-01T00:00:00Z”,
“to”: “2018-05-01T23:59:59Z”
},
“maxCloudCoverage”: 4
}
}
]
},
“output”: {
“width”: 1122.8268621383063,
“height”: 790.1948375460967,
“responses”: [
{
“identifier”: “default”,
“format”: {
“type”: “image/tiff”
}
}
]
},
“evalscript”: "//VERSION=3 (auto-converted from 1)\nfunction setup() {\n return {\n input: [{\n bands: ["S7"],\n units: "KELVIN"\n }],\n output: { \n bands: 1,\n sampleType: "UINT16"\n }\n }\n}\n// Create a Red gradient visualiser from 274-450 K\nvar viz = ColorGradientVisualizer.createRedTemperature(274,450)\nfunction evaluatePixel(sample) {\n return viz.process(sample.S7);\n}\n\n "
}’
Evalscript:
//VERSION=3 (auto-converted from 1)
function setup() {
return {
input: [{
bands: [“S7”],
units: “KELVIN”
}],
output: {
bands: 1,
sampleType: “UINT16”
}
}
}
// Create a Red gradient visualiser from 274-450 K
var viz = ColorGradientVisualizer.createRedTemperature(274,450)
function evaluatePixel(sample) {
return viz.process(sample.S7);
}
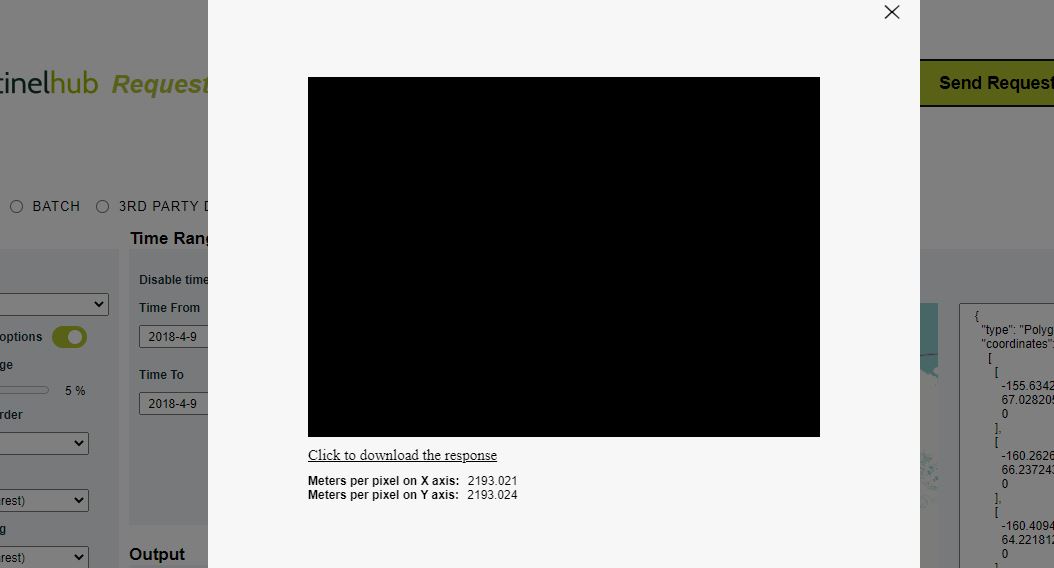
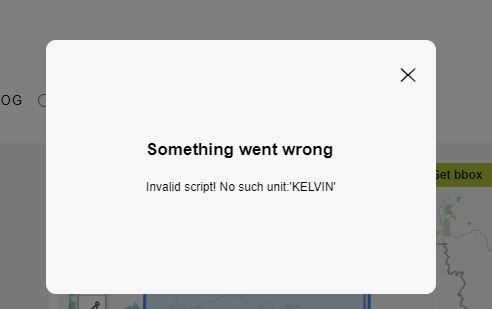
But now there is an error popping up showing no units of kelvin. I do not understand where am I going wrong.
Any assistance will be highly appreciated. Thank you in advance.