Hi I am new in this ecosystem, i am making a crop monitoring app.
working with NDVI need to assign colors based on terciles, quartiles, or in Z-score.
Need to create a https://docs.sentinel-hub.com/api/latest/evalscript/functions/#createdefaultcolormap
But the first column values come from the breaks of terciles, quartiles, or in Z-score.
My python function for quartiles:
def ColorLutFull(img):
    breaks = np.quantile(img, [0.25,0.5,0.75])      # Get breaks of quantiles
    imgColorsIndex = np.searchsorted(breaks,img)    # imagen of colors index
    pallete= np.array([[255, 0, 0], [255, 215, 0], [0, 255, 0], [0, 100, 0],[0, 100, 100]],np.uint8)
    return  pallete[imgColorsIndex] # Generate image with fancy indexing
just only 4 lines, How can do that with eval scripts ?.
In the samples script see that only it is possible to have access one pixel at time.!
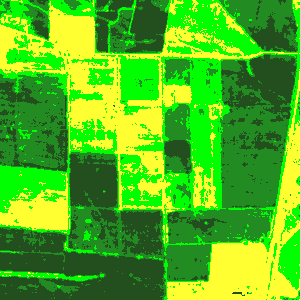
The next picture show the NDVI divided in quartiles
paintedQ4Green|300x300