Good afternoon,
I am interested in your website service and I want to plot the cruise data in the SAR map. I have tried to use the Sentinel Hub to get the SAR sea ice picture from
I use the Image “download function” to get the PNG format picture. After I click the button, this is the link
https://services.sentinel-hub.com/ogc/wms/cd280189-7c51-MASKED?SERVICE=WMS&REQUEST=GetMap&SHOWLOGO=true&MAXCC=100&TIME=2019-06-17%2F2019-06-20&CRS=EPSG%3A4326&FORMAT=image%2Fpng&BBOX=71.2486976%2C-161.6952192%2C70.58384%2C-163.77472&evalscriptoverrides=&LAYERS=1_TRUE_COLOR&WIDTH=4076&HEIGHT=1989&NICENAME=S1.png&TRANSPARENT=0&BGCOLOR=00000000
But when I want to zoom in and change the latitude and longitude in the link, such as
https://services.sentinel-hub.com/ogc/wms/cd280189-7c51-MASKED?SERVICE=WMS&REQUEST=GetMap&SHOWLOGO=true&MAXCC=100&TIME=2019-06-17%2F2019-06-20&CRS=EPSG%3A4326&FORMAT=image%2Fpng&BBOX=72.0486976%2C-160.8952192%2C69.78384%2C-164.57472&evalscriptoverrides=&LAYERS=1_TRUE_COLOR&WIDTH=4076&HEIGHT=1989&NICENAME=S1.png&TRANSPARENT=0&BGCOLOR=00000000
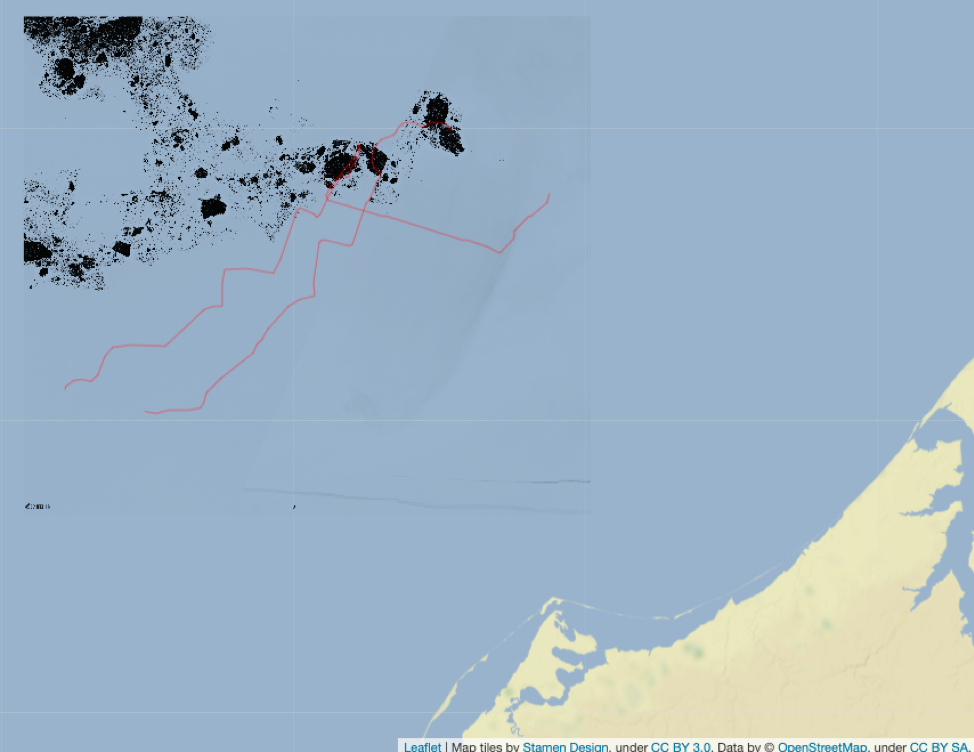
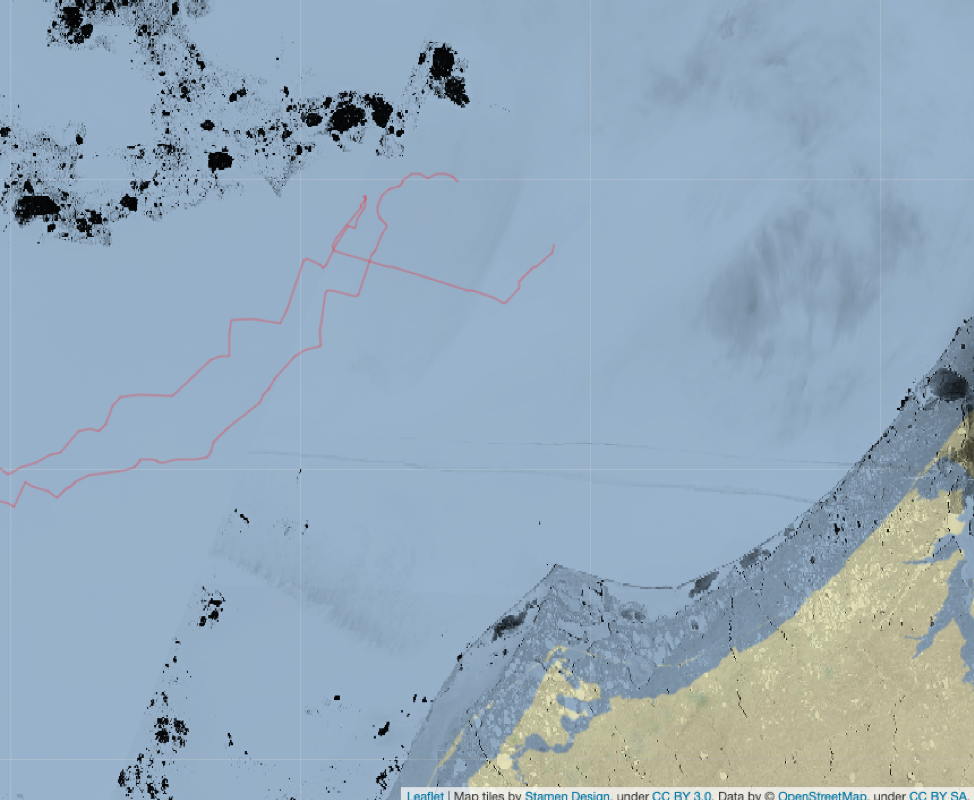
I want a zoom image, just aroung region of our cruises. so i calculate bounding box and run again. it is plotting it in different location… Actually the latitude of the “zoomed in figures” will be shifted north.
Attached is the projection of the original and zoomed in figures at map. It seems that the “zoomed in figures” is wrong.
Do you know how to fix this problem? Thanks a lot.