Yes. It is possible to do this by modifying the Evalscript. A simple reverse() function can be used to reverse the output of the array.
//VERSION=3
// Script to extract a time series of NDVI values using
// Sentinel 2 Level 2A data and  metadata file.
function setup() {
    return {
      input: [{
        bands: ["B04", "B08"],
        units: "DN"
      }],
      output: {
        bands: 1,
        sampleType: SampleType.FLOAT32
      },
      mosaicking: Mosaicking.ORBIT
    }

  }

  // The following function is designed to update the number of
  // output bands without knowing beforehand how many there are
  function updateOutput(outputs, collection) {
      Object.values(outputs).forEach((output) => {
          output.bands = collection.scenes.length;
      });
  }
  // function to generate a json file with a list of the NDVI
  // dates used in the analysis.
  function updateOutputMetadata(scenes, inputMetadata, outputMetadata) {
      var dds = [];
      for (i=0; i<scenes.length; i++){
        dds.push(scenes[i].date)
      }
      outputMetadata.userData = { "acquisition_dates":  JSON.stringify(dds.reverse()) }
  }

  function evaluatePixel(samples) {
    // Precompute an array to contain NDVI observations
    var n_observations = samples.length;
    let ndvi = new Array(n_observations).fill(0);
    // Fill the array with NDVI values
    samples.forEach((sample, index) => {
      ndvi[index] = (sample.B08 - sample.B04) / (sample.B08 + sample.B04) ;
    });
    return ndvi.reverse();
  }
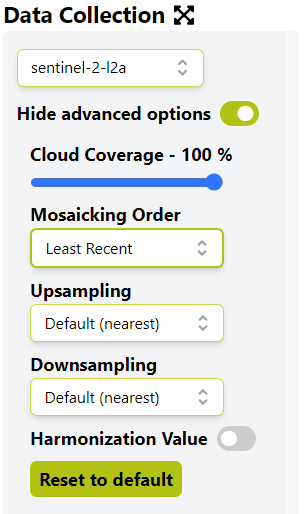
Alternatively, you can set the Mosaicking order to be Least Recent by enabling the Show advanced options in the Requests Builder.