How to display the time series NDVI as gray scale

Hi
given this link
it provide curl-command for getting ndvi values in time series.
i copied the curl-command to the request-builder and executed the command, and what i got is a tiff file with colors.

what i want to know is, how to get the ndvi values of a time series in a gray scale please
is that possible?please let me know how to achieve that

thanks

Hello @sentinelhub19,

The curl request mentioned in the link does indeed provide NDVI having values in the range (0,1) and does exactly what you want it to do. Since this is a multi-temporal script with unknown number of acquisitions within the mentioned time range, NDVI values of each acquisition are saved in a different band in the response. This is why you might see multiple bands in the .tif file. The accompanying userdata.json file includes a list of dates of acquisition.

The GIS software you are using to view the .tif file might consider the first 3 bands as the RGB channels and that might be the reason for seeing coloured image as a result. You can change this visualisation to view only one band at a time in grayscale.

I hope this clears the confusion. Let me know if you need further help.

@megha.devaraju thank you.
.referring to the same link in the question, do you know why i am getting the same tiff with same pixel values even when i change the timerange?

LG

Could you please elaborate on what time range you are looking at so I can recreate the response you are getting? It would be great if you could copy the curl request from the Requests Builder and paste it here. (Avoid posting the any credentials publicly)

P.S.: Just to see the difference in value of each pixel, I suggest you download the Value Tool plugin in QGIS. Then, you can see the change in values over different bands (acquisitions).

@megha.devaraju please find the curl-command posted below. in the example below, the satellite time range is set as follows:

"data": [
  {
    "dataFilter": {
      "timeRange": {
        "from": "2023-03-12T00:00:00Z",
        "to": "2023-08-07T23:59:59Z"
      }
    },
    "type": "sentinel-2-l2a"
  }
]

when i change the time range to, for example, "from": "2022-03-12T00:00:00Z", "to": "2023-08-07T23:59:59Z"
i receive two identical tiffd

would you please help me solve this issue?

curl-command

curl -X POST https://services.sentinel-hub.com/api/v1/process \
 -H 'Content-Type: application/json' \
 -H 'Authorization: Bearer xxx' \
 -H 'Accept: application/tar' \
 -d '{
  "input": {
    "bounds": {
      "geometry": {
        "type": "Polygon",
        "coordinates": [
          [
            [
              1579250.82367497,
              6861560.75494123
            ],
            [
              1579262.05009723,
              6861568.0993758
            ],
            [
              1579274.53666044,
              6861572.98902966
            ],
            [
              1579287.75641312,
              6861575.2175475
            ],
            [
              1579301.15146001,
              6861574.6908805
            ],
            [
              1579314.15650793,
              6861571.431256
            ],
            [
              1580614.32240361,
              6861098.63910992
            ],
            [
              1580626.20934827,
              6861092.89222752
            ],
            [
              1580636.69971985,
              6861084.86506323
            ],
            [
              1580645.36441237,
              6861074.88597658
            ],
            [
              1580651.8490035,
              6861063.36316948
            ],
            [
              1580655.88825164,
              6861050.76798707
            ],
            [
              1580657.31694429,
              6861037.61563564
            ],
            [
              1580656.07665425,
              6861024.44410741
            ],
            [
              1580652.2181275,
              6861011.79217384
            ],
            [
              1580213.19772315,
              6859964.91889461
            ],
            [
              1580207.16807032,
              6859953.72991754
            ],
            [
              1580199.09260609,
              6859943.92221921
            ],
            [
              1580189.27663079,
              6859935.86657521
            ],
            [
              1580178.09124157,
              6859929.86752367
            ],
            [
              1580165.95930318,
              6859926.15185373
            ],
            [
              1580153.33946234,
              6859924.86003288
            ],
            [
              1580140.70880969,
              6859926.0408975
            ],
            [
              1580128.5448448,
              6859929.64980675
            ],
            [
              1578507.57893836,
              6860588.16085359
            ],
            [
              1578495.82259782,
              6860594.40233978
            ],
            [
              1578485.57332546,
              6860602.90455025
            ],
            [
              1578477.25717289,
              6860613.31406842
            ],
            [
              1578471.21983892,
              6860625.19819229
            ],
            [
              1578467.71229861,
              6860638.06291925
            ],
            [
              1578466.88036911,
              6860651.37347985
            ],
            [
              1578468.75864619,
              6860664.57656646
            ],
            [
              1578473.26906401,
              6860677.12333377
            ],
            [
              1578480.22413819,
              6860688.49221449
            ],
            [
              1578750.38594929,
              6861043.08417387
            ],
            [
              1578750.45489957,
              6861043.17450606
            ],
            [
              1578969.96138274,
              6861330.22514622
            ],
            [
              1578980.66035828,
              6861341.24507847
            ],
            [
              1579250.82367497,
              6861560.75494123
            ]
          ]
        ]
      },
      "properties": {
        "crs": "http://www.opengis.net/def/crs/EPSG/0/3857"
      }
    },
    "data": [
      {
        "dataFilter": {
          "timeRange": {
            "from": "2023-03-12T00:00:00Z",
            "to": "2023-08-07T23:59:59Z"
          }
        },
        "type": "sentinel-2-l2a"
      }
    ]
  },
  "output": {
    "width": 512,
    "height": 276.639,
    "responses": [
      {
        "identifier": "default",
        "format": {
          "type": "image/tiff"
        }
      },
      {
        "identifier": "userdata",
        "format": {
          "type": "application/json"
        }
      }
    ]
  },
  "evalscript": "//VERSION=3\n// Script to extract a time series of NDVI values using \n// Sentinel 2 Level 2A data and  metadata file.\nfunction setup() {\n    return {\n      input: [{\n        bands: [\"B04\", \"B08\"],\n        units: \"DN\"\n      }],\n      output: {\n        bands: 1,\n        sampleType: SampleType.FLOAT32\n      },\n      mosaicking: Mosaicking.ORBIT\n    }\n    \n  }\n  \n  // The following function is designed to update the number of\n  // output bands without knowing beforehand how many there are\n  function updateOutput(outputs, collection) {\n      Object.values(outputs).forEach((output) => {\n          output.bands = collection.scenes.length;\n      });\n  }\n  // function to generate a json file with a list of the NDVI \n  // dates used in the analysis. \n  function updateOutputMetadata(scenes, inputMetadata, outputMetadata) {\n      var dds = [];\n      for (i=0; i<scenes.length; i++){\n        dds.push(scenes[i].date)\n      }\n      outputMetadata.userData = { \"acquisition_dates\":  JSON.stringify(dds) }\n  }\n  \n  function evaluatePixel(samples) {\n    // Precompute an array to contain NDVI observations\n    var n_observations = samples.length;\n    let ndvi = new Array(n_observations).fill(0);\n    \n    // Fill the array with NDVI values\n    samples.forEach((sample, index) => {\n      ndvi[index] = (sample.B08 - sample.B04) / (sample.B08 + sample.B04) ;\n    });\n                       \n    return ndvi;\n  }"
}'
The request in the time range from 2023-03-12 to 2023-08-07 returns a .tif file with 60 bands, meaning 60 acquisitions are available and their NDVI is returned. The request in the time range from 2022-03-12 to 2023-08-07 has 203 acquisitions available. The bands are all arranged in the descending order of acquisition, meaning the latest one is the first band and oldest one is the last. Since the time ranges you specified have common dates from 2023-03-12 to 2023-08-07, the results are same for these dates (first 60 bands). If you choose to make another request where there is no overlap between the desired time-slots, then you will see different values of NDVI for these bands.

Hope this answers your question.

@megha.devaraju yes, understood now.however in this link:Normalized difference vegetation index time series | Sentinel Hub custom scripts

for the image posted in section Description of representative images it shows disparate pixel values from 4th of july and from 9th of july. and i assume the to date is the same…am i correct at this point?

if the to data is the same, why we can see disparate pixel values?

i hope my question is clear

@megha.devaraju referring to your reply

The request in the time range from 2022-03-12 to 2023-08-07 has 203 acquisitions available. The bands are all arranged in the descending order of acquisition, meaning the latest one is the first band and oldest one is the last

is it achievable to reverse the order in which the bands are arranged?

Yes. It is possible to do this by modifying the Evalscript. A simple reverse() function can be used to reverse the output of the array.

//VERSION=3
// Script to extract a time series of NDVI values using 
// Sentinel 2 Level 2A data and  metadata file.
function setup() {
    return {
      input: [{
        bands: ["B04", "B08"],
        units: "DN"
      }],
      output: {
        bands: 1,
        sampleType: SampleType.FLOAT32
      },
      mosaicking: Mosaicking.ORBIT
    }
    
  }
  
  // The following function is designed to update the number of
  // output bands without knowing beforehand how many there are
  function updateOutput(outputs, collection) {
      Object.values(outputs).forEach((output) => {
          output.bands = collection.scenes.length;
      });
  }
  // function to generate a json file with a list of the NDVI 
  // dates used in the analysis. 
  function updateOutputMetadata(scenes, inputMetadata, outputMetadata) {
      var dds = [];
      for (i=0; i<scenes.length; i++){
        dds.push(scenes[i].date)
      }
      outputMetadata.userData = { "acquisition_dates":  JSON.stringify(dds.reverse()) }
  }
  
  function evaluatePixel(samples) {
    // Precompute an array to contain NDVI observations
    var n_observations = samples.length;
    let ndvi = new Array(n_observations).fill(0);
    // Fill the array with NDVI values
    samples.forEach((sample, index) => {
      ndvi[index] = (sample.B08 - sample.B04) / (sample.B08 + sample.B04) ;
    });                   
    return ndvi.reverse();
  }

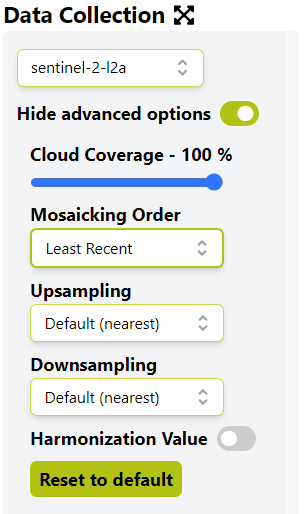
Alternatively, you can set the Mosaicking order to be Least Recent by enabling the Show advanced options in the Requests Builder.

Hello,

Your question is slightly unclear to me. As my colleague @chung.horng already mentioned here, you will need to change the Render Type in Symbology on QGIS to Singleband Gray and select the band respective to the date in the userdata.json file. This way, you can get the NDVI for different dates.

For example, if your time range is from 1st July 2022 to 11th July 2022, and this results in 2 acquisitions (on 4th and 9th July), then Band 001 would be the NDVI for 9th July and Band 002 will be the NDVI for 4th July.

This topic was automatically closed 60 days after the last reply. New replies are no longer allowed.