How to download high size images?

Hello,

I want to download high size images such as 49572x21256. However, unfortunatelly senitnelhub can just provide 2500x2500 size images. Is there any way to solve this problem ?

I developed two algorithm but they do not work properly.

first algorithm:

To collect images:

import numpy as np
from shapely.geometry import MultiLineString, MultiPolygon, Polygon, shape
import cv2

from sentinelhub import (
    CRS,
    BBox,
    BBoxSplitter,
)
import sentinelhub
from shapely import geometry

            patch_x = 30
            patch_y = 30
            
            coords_ =  [
                        [
                          [
                            37.81111,
                            38.724315
                          ],
                          [
                            43.552852,
                            38.724315
                          ],
                          [
                            43.552852,
                            36.614646
                          ],
                          [
                            37.81111,
                            36.614646
                          ],
                          [
                            37.81111,
                            38.724315
                          ]
                        ]
                      ]
            
            
            coords = geometry.Polygon([[p[0], p[1]] for p in coords_[0]])
            
                bbox_splitter = BBoxSplitter(
                [shape(coords)], CRS.WGS84, (patch_x, patch_y),
            ) 
            coords = bbox_splitter.bbox_list
            coords = numpy.array(coords)
            coords = numpy.reshape(coords, (patch_x,patch_y))


            for x in range(patch_x):
                if not os.path.isdir("test/{}".format(str(x))):
                    
                    os.mkdir("test/{}".format(str(x)))
                for y in range(patch_y):
                    coord = coords[x,y].get_geojson()['coordinates']
                    
                    x_min_, y_min_ = numpy.min(numpy.array(coord), axis = 1)[0]
                    x_max_, y_max_ = numpy.max(numpy.array(coord), axis = 1)[0]
                    BBox = sentinelhub.BBox([x_min,y_min,x_max,y_max],crs = sentinelhub.CRS.WGS84)
                    size = sentinelhub.bbox_to_dimensions(BBox, resolution = 10)
                    request = sentinelhub.SentinelHubRequest(
                    evalscript=script,
                    input_data=[
                        sentinelhub.SentinelHubRequest.input_data(
                            data_collection=sentinelhub.DataCollection.SENTINEL2_L2A,
                            time_interval=("2022-04-01", "2022-30"),
                            maxcc=0.9,
                        )
                    ],
                    image=[sentinelhub.SentinelHubRequest.output_response("default", sentinelhub.MimeType.TIFF)],
                
                    bbox=BBox,
                    size=size
                    config=config,
                    ).get_data()[0]

                    cv2.imwrite("test/{}/{}.tiff".format(x,y),image)

To merge images:

target = 'test'
folders = list(range(len([i for i in os.listdir(target)])))

ref_w = 0
image = numpy.zeros((25000,55000,3),dtype = numpy.uint8)
#folders.reverse()
for folder in folders:
    rows = []
    folder_name = str(folder)
    files = list(range(len(os.listdir(os.path.join(target, folder_name)))))
    files.reverse()
    print(folder)
    ref_h = 0
    for file in files:
        file_name = str(file) + ".tiff"
        tmp_image = cv2.imread(os.path.join(target,folder_name,file_name))
        tmp_w = tmp_image.shape[1]
        tmp_h = tmp_image.shape[0]
        image[ref_h:ref_h + tmp_h, ref_w:ref_w + tmp_w,:] = tmp_image
        ref_h = tmp_h + ref_h
    ref_w = tmp_w + ref_w
    #image = image[:,::-1,:]
    print(ref_w, ref_h)
cv2.imwrite("tmp2.tiff",image)

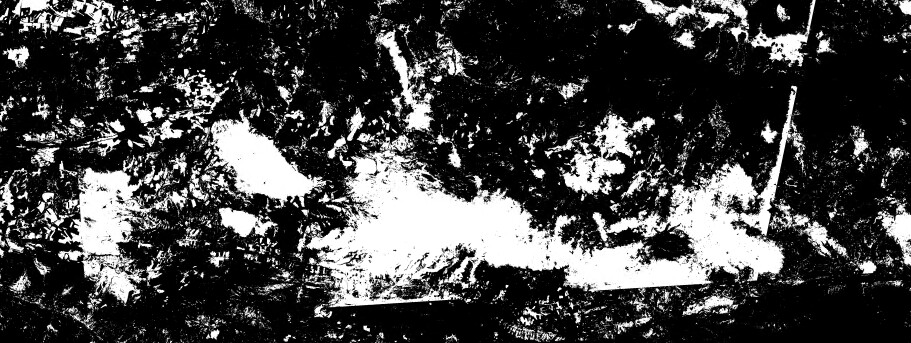
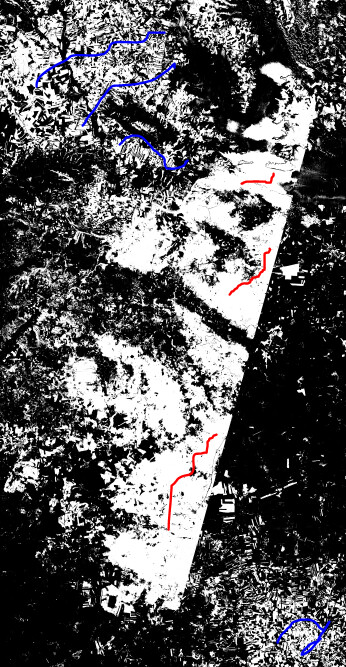
It is so useful but unfortunatelly in intersections, it has spaces. And it is curved when look at the whole image. Unfortunatelly sentinelhub forum does not let me to share second image which has curve.

Second algorithm

res = 2500
 coords =  [
                        [
                          [
                            37.81111,
                            38.724315
                          ],
                          [
                            43.552852,
                            38.724315
                          ],
                          [
                            43.552852,
                            36.614646
                          ],
                          [
                            37.81111,
                            36.614646
                          ],
                          [
                            37.81111,
                            38.724315
                          ]
                        ]
                      ]
                   x_min_, y_min_ = numpy.min(numpy.array(coord), axis = 1)[0]
                   x_max_, y_max_ = numpy.max(numpy.array(coord), axis = 1)[0]
                   bbox = [x_min,y_min,x_max,y_max]
                   size = sentinelhub.bbox_to_dimensions(bbox, resolution = 10)
            
                   step_x = round(size[0]/res)
                   step_y = round(size[1]/res)
                    
                   points_x = numpy.linspace(x_min,x_max,step_x)
                   points_y = numpy.linspace(y_min, y_max,step_y)
                    
                   ratio_y = size[1]/(y_max-y_min)
                   ratio_x = size[0]/(x_max - x_min)
                    
                    
                    size_x = len(points_x)
                    size_y = len(points_y)
        
                    images = []
                    rows = []
                    for y in range(len(points_y)-1):
                        
                        rows = []
                        for x in range(len(points_x)-1):
                            tmpcoords = [[[points_x[x],points_y[y]],[points_x[x],points_y[y+1]], 
                            [points_x[x+1],points_y[y]],[points_x[x+1],points_y[y+1]]]]
                        
                            x_min, y_min = numpy.min(tmpcoords, axis = 1)[0]
                            x_max, y_max = numpy.max(tmpcoords, axis = 1)[0]
                            BBox = sentinelhub.BBox([x_min,y_min,x_max,y_max],crs = sentinelhub.CRS.WGS84)
                            
                            BBox = sentinelhub.BBox([x_min,y_min,x_max,y_max],crs = 
                                                                      sentinelhub.CRS.WGS84)
                            request = sentinelhub.SentinelHubRequest(
                            evalscript=script,
                            input_data=[
                                sentinelhub.SentinelHubRequest.input_data(
                                    data_collection=sentinelhub.DataCollection.SENTINEL2_L2A,
                                    time_interval=("2022-04-01", "2022-30"),
                                    maxcc=0.9,
                                )
                            ],
                            image=[sentinelhub.SentinelHubRequest.output_response("default", sentinelhub.MimeType.TIFF)],
                        
                            bbox=bbox,
                            size=(2500,2500)
                            config=config,
                            ).get_data()[0]
                            
                            rows.append(image)


                            print((x,y),(x,y+1),(x+1,y),(x+1,y+1))
                            
                        rows = numpy.concatenate(rows, axis = 1)
                        images.append(rows)
                        
                    images = images[::-1]
                    images = numpy.concatenate(images,axis =0)


If I summarize two algorithms; in first, I take them in their original size with respect to 10 meter resolution, save them and merge them in another script. In second algorithm, I split the coordinates so that their resolution are 10 meter and sizes are 2500x2500

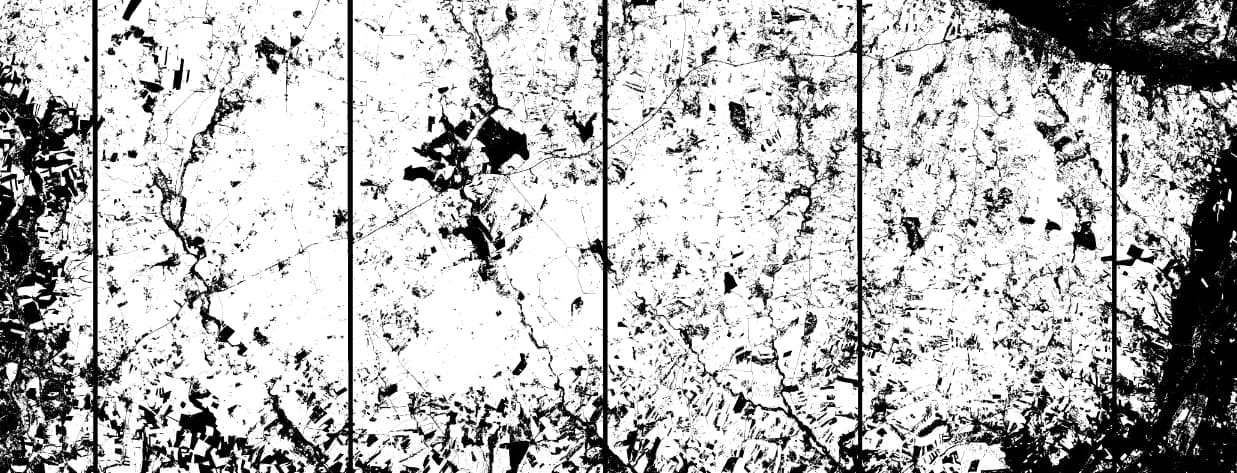
In first algorithm, there is some spaces between patches and the big image, merged image is curved.
In second algorithm, although I split image into patches so that their sizes are 2500x2500, unfortunatelly their size are not always 2500x2500 so its resolution changes.

What is most efficient way to take high size images except changing its original size and resolution ?

Thanks for your helps…

Hi,

I suggest you first take a look at the large area utilities example, which describes some ways of splitting the area.

For efficient download of very large areas you might also be interested in batch download.

@ziga.luksic I reviewed it before coding my algorithms and I used bbox_splitter as well but merging the image is a problem. I can not merge it properly.

Since you’re saving data as .tiff files I would suggest looking into GDAL, as it is a powerful tool. Our eo-grow tool also contains some helper functions, which might help you with how to use GDAL.

Regarding the curvature, it (almost surely) comes from the fact that you are using CRS.WGS84. Perhaps try using the UTM splitter, which returns BBoxes with UTM zone CRS. These tend to work better for most approaches, but in very large areas you might encounter issues with having multiple CRS zones.

@ziga.luksic thanks for your reply. Is there any example to get images properly and merge them ?

Sadly I can’t think of an example where this would be shown directly.
For download just try using UtmZoneSplitter instead of BBoxSplitter to get rid of the curving.

For merging you can take a look at gdal_merge.py

Hey @bomala6664 ! You could have a look at GitHub - AdrienWehrle/earthspy: Monitor and study any place on Earth and in Near Real-Time (NRT) using the Sentinel Hub services developed by the EO research team at Sinergise and use it in “split and merge” mode (it is the default one)! Don’t hesitate to ask if you have any questions!

1 Like

@adrien.wehrle1 Thanks for your reply. What a coincidence, I also encountered with this repository today and I think it is so useful and best. When I take an image with your library, there are some noises.

Do you see, there are some white areas which is seems they are not belong to actual area. What is the problem ?

Hi @bomala6664! Glad you find the tool useful!

there are some white areas which is seems they are not belong to actual area

Are you talking about all white areas visible on your screenshot or only certain parts?

Have a nice day,
best,
Adrien

@adrien.wehrle1 just certain parts, there are so fitted, sharp, squared white ares.

blue ones are normal but red ones are not belong to the image.

My another question is that; when I set time interval to get image, it returns a lot of mosaic image from different dates and some of them include some areas but not other areas, and anothers include other areas . However, I just want to get one image,

It looks like a result of the merge! You can decide to keep the single scenes before merging, and check if this sharp boundary is indeed a scene boundary!

My another question is that; when I set time interval to get image, it returns a lot of mosaic image from > different dates and some of them include some areas but not other areas, and anothers include other > areas . However, I just want to get one image,

Setting a time interval gives you access to all images within this period. But I think I understand you would like only one. But which one? Would you like a least cloudy image?

Could you please post those two issues (white patches + time selection) you are sharing here on Discussions · AdrienWehrle/earthspy · GitHub? So we 1) can track earthspy discussions and 2) don’t spam the Sentinel Hub Forum! Thank you a lot in advance!

Thanks for your helps. I nearly solved white patches problem, it is not about your tool. It is about ndvi value. Sometimes clouds reflect high ndvi value as well, and I solved it by checking SCL band. For another, question I started a discussion and issue on your github page. Here my eval script to solve white patches problem;


//VERSION=3 (auto-converted from 1)

//Basic initialization setup function
function setup() {
  return {
	//List of all bands, that will be used in the script, either for visualization or for choosing best pixel
    input: [{
      bands: [
         "B04",
         "B08",
         "SCL"
      ]
    }],
	//This can always be the same if one is doing RGB images
    output: { bands: 1 },
    mosaicking: "ORBIT"
  }
}

/*
In this function we limit the scenes, which are used for processing. 
These are based also on input variables, coming from Playground. 
E.g. if one sets date "2017-03-01" ("TO date") and cloud coverage filter 30%, 
all scenes older than 2017-03-01 with cloud coverage 30% will be checked against
further conditions in this function.
The more scenes there are, longer it will take to process the data.
After 60 seconds of processing, there will be a timeout.
*/

function filterScenes (scenes, inputMetadata) {
    return scenes.filter(function (scene) {
//Here we limit data between "(TO date - 1 month) to (TO date)
	  return scene.date.getTime()>=(inputMetadata.to.getTime()-1*31*24*3600*1000) ;
    });
}

function calcNDVI(sample) {
  var denom = sample.B04+sample.B08;
  switch(sample.SCL){
      
      // Unclassified (dark grey)
    case 7: return [0];
    
    // Cloud medium probability (grey)
    case 8: return [0];
        
    // Cloud high probability (white)
    case 9: return [0];
      }
  return ((denom!=0) ? (sample.B08-sample.B04) / denom : 0.0);
}
function evaluatePixel(samples) {  
  var max = 0;
  for (var i=0;i<samples.length;i++) {
      var ndvi = calcNDVI(samples[i]);
    max = ndvi > max ? ndvi:max;
  }


if (max>0.53) return [1];
else return [0]

}