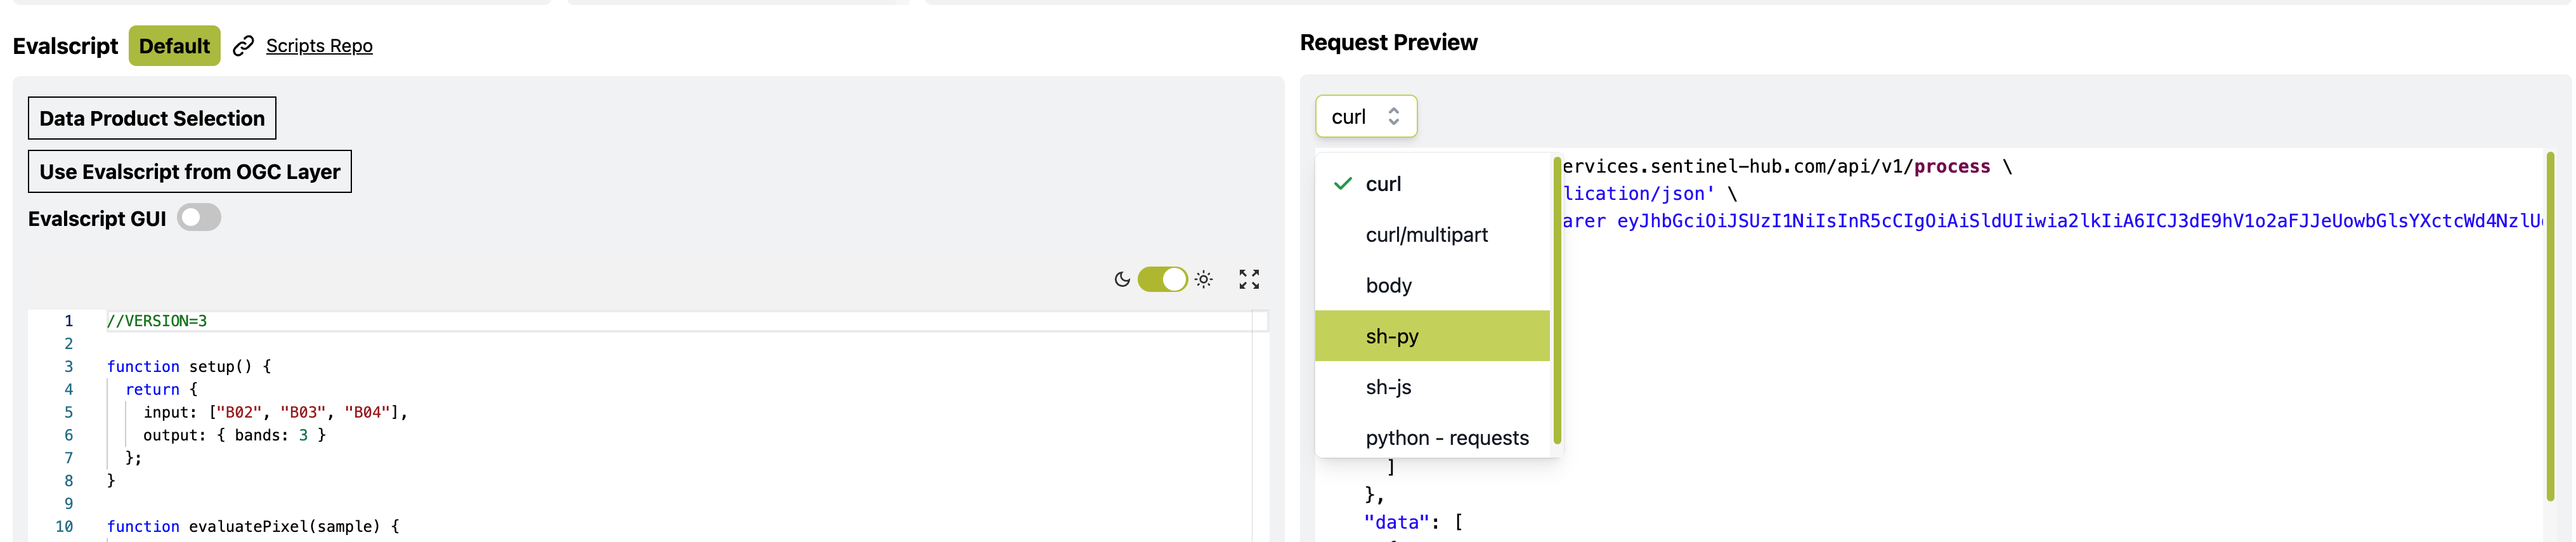
I have tried to generate a processing API as
This is script may only work with sentinelhub.version >= ‘3.4.0’
from sentinelhub import SentinelHubRequest, DataCollection, MimeType, CRS, BBox, SHConfig, Geometry
evalscript = “”"
//VERSION=3
function setup() {
return {
input: [
{
bands: [“S8”],
datasource:“DataCollection.SENTINEL3_SLSTR”
},
{
bands: [“B06”,“B08”,“B17”],
datasource:“DataCollection.SENTINEL3_OLCI”
}
],
output: [
{
id: “default”,
bands: 1,
sampleType: “FLOAT32”,
noDataValue: 0,
},
],
mosaicking: “SIMPLE”,
};
}
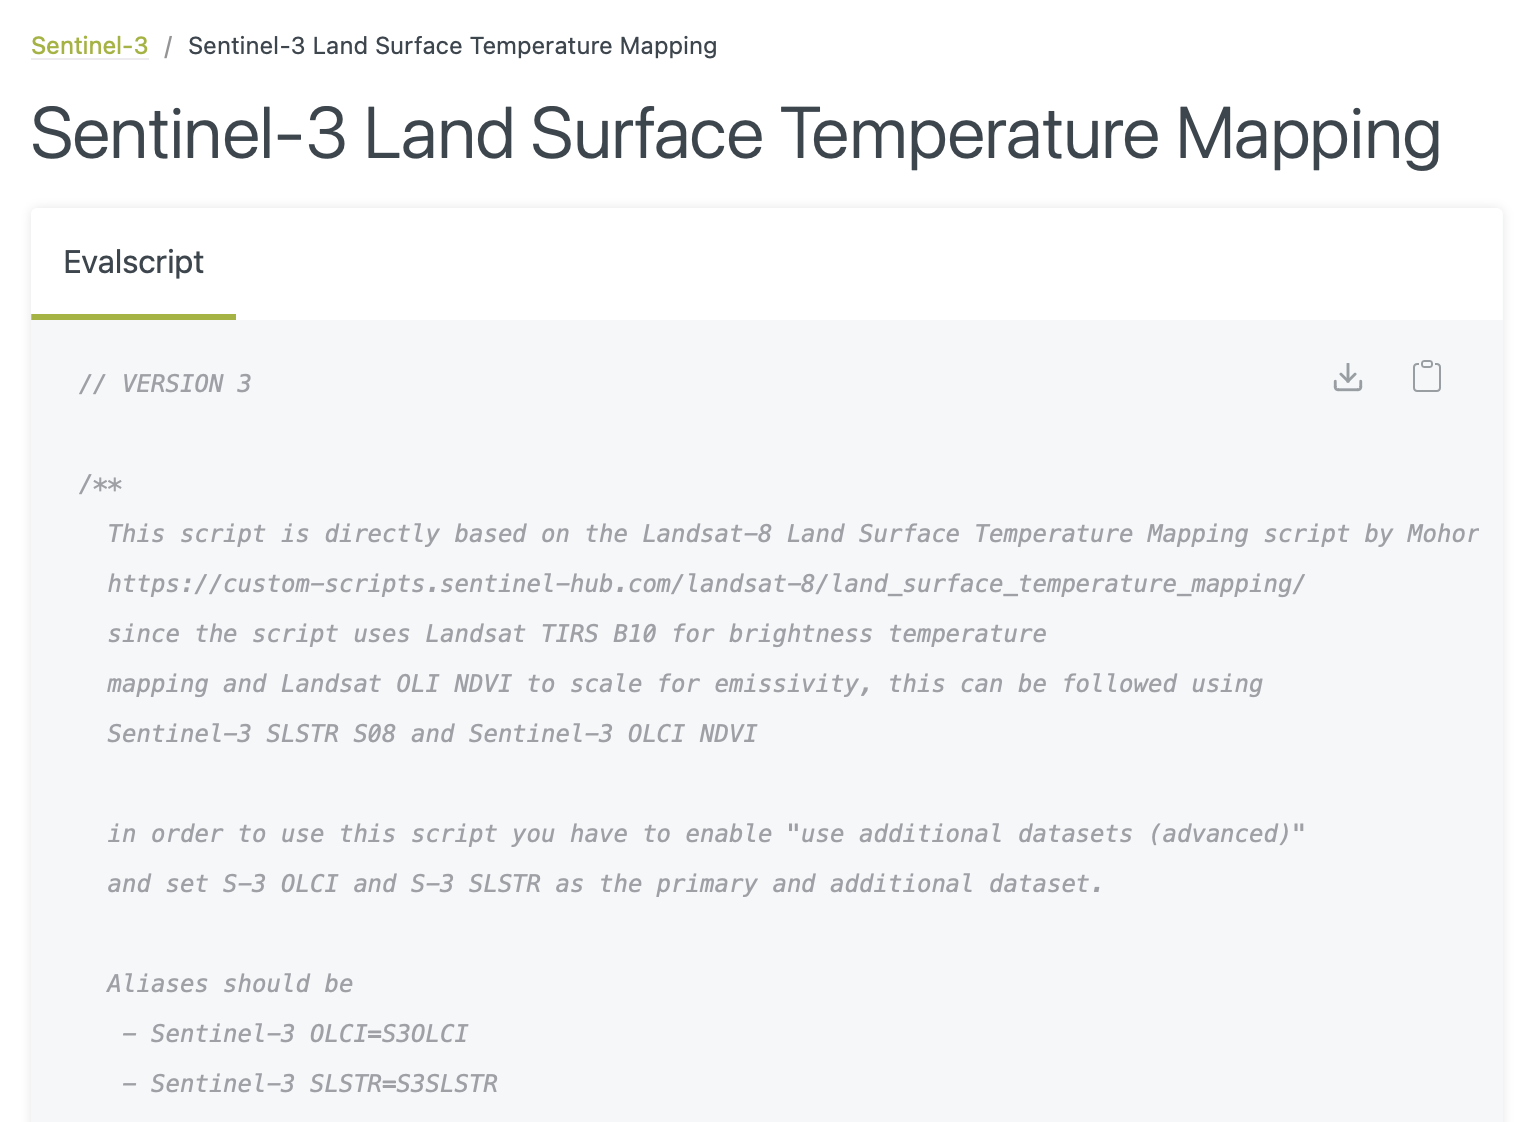
// VERSION 3
/**
This script is directly based on the Landsat-8 Land Surface Temperature Mapping script by Mohor Gartner
Land Surface Temperature (LST) Mapping Script | Sentinel Hub custom scripts
since the script uses Landsat TIRS B10 for brightness temperature
mapping and Landsat OLI NDVI to scale for emissivity, this can be followed using
Sentinel-3 SLSTR S08 and Sentinel-3 OLCI NDVI
in order to use this script you have to enable “use additional datasets (advanced)”
and set S-3 OLCI and S-3 SLSTR as the primary and additional dataset.
Aliases should be
- Sentinel-3 OLCI=S3OLCI
- Sentinel-3 SLSTR=S3SLSTR
STARTING OPTIONS
for analysis of one image (EO Browser), choose option=0. In case of MULTI-TEMPORAL analyis,
option values are following:
0 - outputs average LST in selected timeline (% of cloud coverage should be low, e.g. < 10%)
1 - outputs maximum LST in selected timeline (% of cloud coverage can be high)
2 - THIS OPTION IS CURRENTLY NOT FUNCTIONAL - outputs standard deviation LST in selected timeline;
minTemp and highTemp are overwritten with values 0 and 10 (% of cloud coverage should be low, e.g. < 5%)
*/
var option = 0;
// minimum and maximum values for output colour chart red to white for temperature in °C. Option 2 overwrites this selection!
var minC = 0;
var maxC = 50;
////INPUT DATA - FOR BETTER RESULTS, THE DATA SHOULD BE ADJUSTED
// NVDIs for bare soil and NDVIv for full vegetation
// Note: NVDIs for bare soil and NDVIv for full vegetation are needed to
// be evaluated for every scene. However in the custom script, default values are set regarding:
// https://profhorn.meteor.wisc.edu/wxwise/satmet/lesson3/ndvi.html
// https://www.researchgate.net/post/Can_anyone_help_me_to_define_a_range_of_NDVI_value_to_extract_bare_soil_pixels_for_Landsat_TM
// NVDIs=0.2, NDVIv=0.8
// other source suggests global values: NVDIs=0.2, NDVIv=0.5;
// https://www.researchgate.net/publication/296414003_Algorithm_for_Automated_Mapping_of_Land_Surface_Temperature_Using_LANDSAT_8_Satellite_Data
var NDVIs = 0.2;
var NDVIv = 0.8;
// emissivity
var waterE = 0.991;
var soilE = 0.966;
var vegetationE = 0.973;
//var buildingE=0.962;
var C = 0.009; //surface roughness, https://www.researchgate.net/publication/331047755_Land_Surface_Temperature_Retrieval_from_LANDSAT-8_Thermal_Infrared_Sensor_Data_and_Validation_with_Infrared_Thermometer_Camera
//central/mean wavelength in meters, Sentinel-3 SLSTR B08 (almost the same as Landsat B10)
var bCent = 0.000010854;
// rho =hc/sigma=PlanckCvelocityLight/BoltzmannC
var rho = 0.01438; // m K
//// visualization
// if result should be std dev (option=2), overwrite minMaxC.
if (option == 2) {
minC = 0;
maxC = 25;
}
let viz = ColorGradientVisualizer.createRedTemperature(minC, maxC);
//this is where you set up the evalscript to access the bands of the two datasets in the fusion
function setup() {
return {
input: [
{ datasource: “S3SLSTR”, bands: [“S8”] },
{ datasource: “S3OLCI”, bands: [“B06”, “B08”, “B17”] }],
output: [
{ id: “default”, bands: 3, sampleType: SampleType.AUTO }
],
mosaicking: “ORBIT”
}
}
//emissivity calc (Unchanged from Landsat script)
//https://www.researchgate.net/publication/296414003_Algorithm_for_Automated_Mapping_of_Land_Surface_Temperature_Using_LANDSAT_8_Satellite_Data
//(PDF) Investigating Land Surface Temperature Changes Using Landsat Data in Konya, Turkey | Osman ORhan - Academia.edu
function LSEcalc(NDVI, Pv) {
var LSE;
if (NDVI < 0) {
//water
LSE = waterE;
} else if (NDVI < NDVIs) {
//soil
LSE = soilE;
} else if (NDVI > NDVIv) {
//vegetation
LSE = vegetationE;
} else {
//mixtures of vegetation and soil
LSE = vegetationE * Pv + soilE * (1 - Pv) + C;
}
return LSE;
}
function evaluatePixel(samples) {
// starting values max, avg, stdev, reduce N, N for multi-temporal
var LSTmax = -999;
var LSTavg = 0;
var LSTstd = 0;
var reduceNavg = 0;
var N = samples.S3SLSTR.length;
//to caputure all values of one pixel for for whole timeline in mosaic order
var LSTarray = [];
// multi-temporal: loop all samples in selected timeline
for (let i = 0; i < N; i++) {
//// for LST S8
var Bi = samples.S3SLSTR[i].S8;
var B06i = samples.S3OLCI[i].B06;
var B08i = samples.S3OLCI[i].B08;
var B17i = samples.S3OLCI[i].B17;
// some images have errors, whole area is either B10<173K or B10>65000K. Also errors, where B06 and B17 =0. Therefore no processing if that happens, in addition for average and stdev calc, N has to be reduced!
if ((Bi > 173 && Bi < 65000) && (B06i > 0 && B08i > 0 && B17i > 0)) {
  // ok image
  //1 Kelvin to C
  var S8BTi = Bi - 273.15;
  //2 NDVI - Normalized Difference vegetation Index - based on this custom script: https://custom-scripts.sentinel-hub.com/sentinel-3/ndvi/
  var NDVIi = (B17i - B08i) / (B17i + B08i);
  //3 PV - proportional vegetation
  var PVi = Math.pow(((NDVIi - NDVIs) / (NDVIv - NDVIs)), 2);
  //4 LSE land surface emmisivity
  var LSEi = LSEcalc(NDVIi, PVi);
  //5 LST
  var LSTi = (S8BTi / (1 + (((bCent * S8BTi) / rho) * Math.log(LSEi))));

  ////temporary calculation
  //avg
  LSTavg = LSTavg + LSTi;
  //max
  if (LSTi > LSTmax) { LSTmax = LSTi; }
  //array
  LSTarray.push(LSTi);
} else {
  // image NOT ok
  ++reduceNavg;
}
}
// correct N value if some images have errors and are not analysed
N = N - reduceNavg;
// calc final avg value
LSTavg = LSTavg / N;
// calc final stdev value
for (let i = 0; i < LSTarray.length; i++) {
LSTstd = LSTstd + (Math.pow(LSTarray[i] - LSTavg, 2));
}
LSTstd = (Math.pow(LSTstd / (LSTarray.length - 1), 0.5));
// WHICH LST to output, it depends on option variable: 0 for one image analysis (OE Browser); MULTI-TEMPORAL: 0->avg; 1->max; 2->stdev
let outLST = (option == 0)
? LSTavg
: (option == 1)
? LSTmax
: LSTstd;
//// output to image
return viz.process(outLST);
}
“”"
bbox = BBox(bbox=[75.866267, 30.516428, 75.90102, 30.545409], crs=CRS.WGS84)
request = SentinelHubRequest(
evalscript=evalscript,
input_data=[
SentinelHubRequest.input_data(
data_collection=DataCollection.SENTINEL3_SLSTR,
time_interval=(‘2023-07-01’, ‘2024-03-03’),
),
SentinelHubRequest.input_data(
data_collection=DataCollection.SENTINEL3_OLCI,
time_interval=(‘2023-07-01’, ‘2023-07-03’),
),
],
responses=[
SentinelHubRequest.output_response(‘default’, MimeType.TIFF),
],
bbox=bbox,
size=[3.3328097651607824, 3.22615016267937],
config=config
)
response = request.get_data()
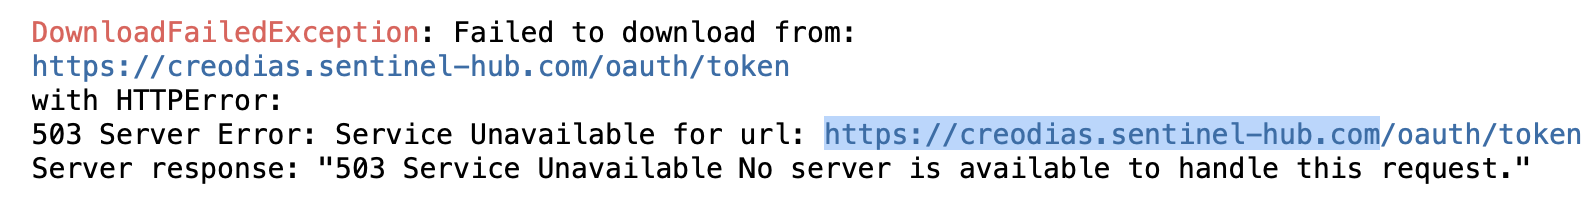
But in the end I get an error
DownloadFailedException: Failed to download from:
https://creodias.sentinel-hub.com/oauth/token
with HTTPError:
503 Server Error: Service Unavailable for url: https://creodias.sentinel-hub.com/oauth/token
Server response: “503 Service Unavailable No server is available to handle this request.”