How to get an Image for process api

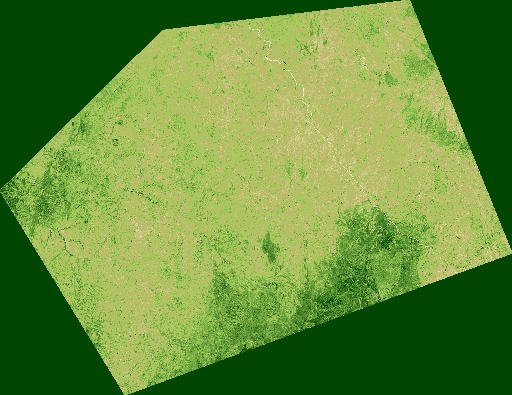
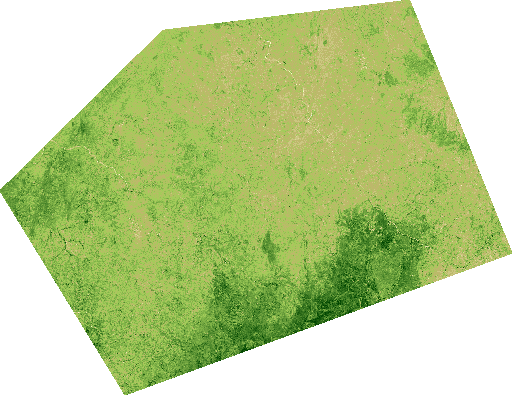
I am trying to write a service that gets the NDVI index of place passed in by a geometry and returns its image now when I write this api
response = request.get_data() returns an array and I can"t seem to get how to return the actually image using python

class vegetativeIndexView(APIView):
   

    def get(self, request):
        #Credentials

        CLIENT_ID = 'client_id'
        CLIENT_SECRET = 'secrete'
        config = SHConfig()

        if CLIENT_ID and CLIENT_SECRET:
            config.sh_client_id = CLIENT_ID
            config.sh_client_secret = CLIENT_SECRET
        else:
            config = None

                
        evalscript = """
            //VERSION=3
            function setup() {
                return {
                        input: [{
                        bands:["B04", "B08"],
                        }],
                        output: {
                        id: "default",
                        bands: 3,
                        }
                    };
                }

            function evaluatePixel(sample) {
                    let ndvi = (sample.B08 - sample.B04) / (sample.B08 + sample.B04)
                    
                    if (ndvi<-0.5) return [0.05,0.05,0.05]
                    else if (ndvi<-0.2) return [0.75,0.75,0.75]
                    else if (ndvi<-0.1) return [0.86,0.86,0.86]
                    else if (ndvi<0) return [0.92,0.92,0.92]
                    else if (ndvi<0.025) return [1,0.98,0.8]
                    else if (ndvi<0.05) return [0.93,0.91,0.71]
                    else if (ndvi<0.075) return [0.87,0.85,0.61]
                    else if (ndvi<0.1) return [0.8,0.78,0.51]
                    else if (ndvi<0.125) return [0.74,0.72,0.42]
                    else if (ndvi<0.15) return [0.69,0.76,0.38]
                    else if (ndvi<0.175) return [0.64,0.8,0.35]
                    else if (ndvi<0.2) return [0.57,0.75,0.32]
                    else if (ndvi<0.25) return [0.5,0.7,0.28]
                    else if (ndvi<0.3) return [0.44,0.64,0.25]
                    else if (ndvi<0.35) return [0.38,0.59,0.21]
                    else if (ndvi<0.4) return [0.31,0.54,0.18]
                    else if (ndvi<0.45) return [0.25,0.49,0.14]
                    else if (ndvi<0.5) return [0.19,0.43,0.11]
                    else if (ndvi<0.55) return [0.13,0.38,0.07]
                    else if (ndvi<0.6) return [0.06,0.33,0.04]
                    else if (ndvi==0) return [1, 1, 1]
                    else return [0,0.27,0]
                }       
                    
        """

        
        bbox = BBox(bbox=[6.394761, 11.482716, 7.136298, 12.044693], crs=CRS.WGS84)
        geometry = Geometry(geometry={"type":"Polygon","coordinates":[[[6.630955,12.001712],[6.987991,12.044693],[7.136298,11.684514],[6.576026,11.482716],[6.394761,11.773259],[6.630955,12.001712]]]}, crs=CRS.WGS84)

        request = SentinelHubRequest(
        data_folder = 'nidvii',
        evalscript=evalscript,
        input_data=[
            SentinelHubRequest.input_data(
            data_collection=DataCollection.SENTINEL2_L2A,
            time_interval=('2021-04-22', '2021-05-22'),    
        )
        ],
        responses=[
            SentinelHubRequest.output_response('default', MimeType.PNG),
            
        ],
        #bbox=bbox, 
        geometry=geometry,
        size=[512, 395.946],
        config=config
        )
        response = request.get_data(save_data=True) 
     
        return Response(response, status=status.HTTP_200_OK, content_type='image/*')

Hi Femii,

In the response on GitHub, AlexMat has already given you rather good pointers; if you carefully compare, the first difference is getting the numpy_image:

numpy_image = request_ndvi.get_data()[0]

(get_data returns a list, so you have to get the first item to get to the image). After you get that, I suggest you try first visualising this numpy_image, or at least making sure that the response has the data you are after.

After that, the main issue you have is how to convert numpy array into a png image that you can serve through your service. For that, a bit of googling reveals that (using flask):

Again, most of this AlexMat already covered in his response.

Best of luck!

PS: Cross-post from [HELP] I am creating an api endpoint to return an Image · Issue #179 · sentinel-hub/sentinelhub-py · GitHub

that is the problem I am facing I am using Django… and the flask implementation does not work for me at all

I suggest you turn for help to Django community.

Perhaps python - In the django web project, how to translate BytesIO object to image url? How to convert the file stream(image) to the original image file? - Stack Overflow

thank you very much

second thing I need help is why do I still get the box surrounding my field i.e(geometry shape ) how can I get just the shape
response

I want to remove the background and have just the shape

using this evalscript

  evalscript = """
            //VERSION=3
            function setup() {
                return {
                        input: [{
                        bands:["B04", "B08", "dataMask"],
                        }],
                        output: {
                        id: "default",
                        bands: 4,
                        }
                    };
                }


            function evaluatePixel(sample) {
                let ndvi = (sample.B08 - sample.B04) / (sample.B08 + sample.B04)
                if (sample.dataMask == 1){
                    
                    
                    if (ndvi<-0.5) return [0.05,0.05,0.05, 1]
                    else if (ndvi<-0.2) return [0.75,0.75,0.75, 1]
                    else if (ndvi<-0.1) return [0.86,0.86,0.86, 1]
                    else if (ndvi<0) return [0.92,0.92,0.92, 1]
                    else if (ndvi<0.025) return [1,0.98,0.8, 1]
                    else if (ndvi<0.05) return [0.93,0.91,0.71, 1]
                    else if (ndvi<0.075) return [0.87,0.85,0.61, 1]
                    else if (ndvi<0.1) return [0.8,0.78,0.51, 1]
                    else if (ndvi<0.125) return [0.74,0.72,0.42, 1]
                    else if (ndvi<0.15) return [0.69,0.76,0.38, 1]
                    else if (ndvi<0.175) return [0.64,0.8,0.35, 1]
                    else if (ndvi<0.2) return [0.57,0.75,0.32, 1]
                    else if (ndvi<0.25) return [0.5,0.7,0.28, 1]
                    else if (ndvi<0.3) return [0.44,0.64,0.25, 1]
                    else if (ndvi<0.35) return [0.38,0.59,0.21, 1]
                    else if (ndvi<0.4) return [0.31,0.54,0.18, 1]
                    else if (ndvi<0.45) return [0.25,0.49,0.14, 1]
                    else if (ndvi<0.5) return [0.19,0.43,0.11, 1]
                    else if (ndvi<0.55) return [0.13,0.38,0.07, 1]
                    else if (ndvi<0.6) return [0.06,0.33,0.04, 1]
                    else if (ndvi==0) return [1, 1, 1, 1]
                    else return [0,0.27,0, 1]
                }
                else{
                    return [1, 1, 1, 0]
                } 
                } 
                    
        """

I get an image that looks like this
response

But if I change my MIME type to MIME.TIFF I get an image that is grey and distorted
trying to upload it says I can not upload attachments so I took a screenshot

A closer look at the output array from .get_data() outputs the same numbers
is there something I am doing wrong


the output I get when I change using a tiff MIME format

You have already confirmed that the values inside TIFF are the same as the ones in PNG.

The remaining difference between the two formats is that TIFF is georeferenced, while PNG is not. They both represent the same data, but then it is up to the viewer how it is interpreted. With PNG, the RGB+transparency is by standard, while TIFFs can hold any number of channels, with different colormaps, interpretations, etc. If you open your TIFF in a tool like QGIS, you will see it is geopositioned, and you can specify which channels are coloured how (e.g. channel 1 → R, channel 2 → G, …)

Last thing to mention: please check that the only difference you’ve made is the Mime Type. If you have also changed coordinate reference system, then the images will look different because of different projections.

Thank you
that was the only difference made

but one question as I return
return Response(response, status=status.HTTP_200_OK, content_type='image/*')

will the front end be able to display the array because I could now find a way to return an image every other thing works fine

I am such a newbie to django, rest framework and even gis had to binge watch the webinars to come up with this and I have a deadline

I expect setting content type image/* will not work, resulting in the front-end application not knowing how to present/display the content. Use image/tiff or image/png, depending on what you are requesting from SH service. See also common mime types

That being said, dealing with TIFF files in browser/front-end apps is (much) more difficult than with PNGs, but that really depends on what your app is trying to do.

1 Like

So basically the app is meant to have users
register, create a field and that shape file is what I am passing in as my polygon
and I return the NDVI image using that endpoint…

Now I have a question on behalf of the frontend how does he place this on his leaflet map or how do I work with him

Have a look at Sentinel Playground (app and code) and EO-Browser (app and code).

Both use leaflet for map display.

@batic does that mean I have to rewrite my whole code using ogc

because I used sentinel hub python to create the endpoint

Our front end apps are done with javascript, and I assume yours will be done as well.

Your backend can stay as is. It is then just the matter of making your calls (from front-end to backend) work with leaflet. As @z.cern wrote in another issue, you could even opt and try to do everything on frontend.

thank you so much for your quick response @batic so as you have noticed I have worked on the backend is there any sample script template you can help me with to understand how I can integrate the Process API from the sentinelhub.py which I have used to the frontend with leaflet.

or how to work with it from the frontend like @z.cern suggested if I want to follow his suggestion I will like his second option.

I just need a template I don’t mind a pseudo code to point me in the flow of events

thank you very much

I am really sorry, but I think the request for such pseudo code/flow of events falls out of the scope of this forum, which is meant to help users with SH services, and is not a full-stack programming forum.

However, time permitting we (Sinergise) offer implementations of such services. Feel free to ask for a quote in DM.

 evalscript1 = """
        
                //VERSION=3
                function setup() {
                return{
                    input: [{
                    bands: ["B04", "B08"],
                    units: "DN"
                    }],
                    output: {
                   // id: "default",
                    bands: 1,
                    sampleType: "FLOAT32"
                    }
                }
                }
                function evaluatePixel(sample) {
                let ndvi = (sample.B08 - sample.B04) / (sample.B08 + sample.B04)
                return [ ndvi ]
                }
                
                """

using this evalscript throws an error saying
Out of range float values are not JSON compliant

any help on what I can do about that and after placing it in leaflet how do I make tooltip show the value of each NDVI point on the image