The data of October 22, 2020 is obtained, JSON returns four pieces of data, which are C0 / C1 / C2 / C3, I don’t know if it is useful for me. Which data of C0 / C1 / C2 / C3 should have previously
So basically a fis-request returns a JSON response with basic statistics of every band found in the layer that you specified.
So in your case, the NDVI layer probably has 4 bands that is why you get C0/C1/C2/C3. C0 has statistics for band1, C1 has statistics for band2 …
I think it will be useful for you that your NDVI layer has only 1 band , and for that, you need to specify in the evalscript to output only 1 band which is the NDVI band. The evalscript in your configuration should be similar with what you have in the previous exampe
With that you should be getting NDVI statistics like these:
Hi doronthyrono,
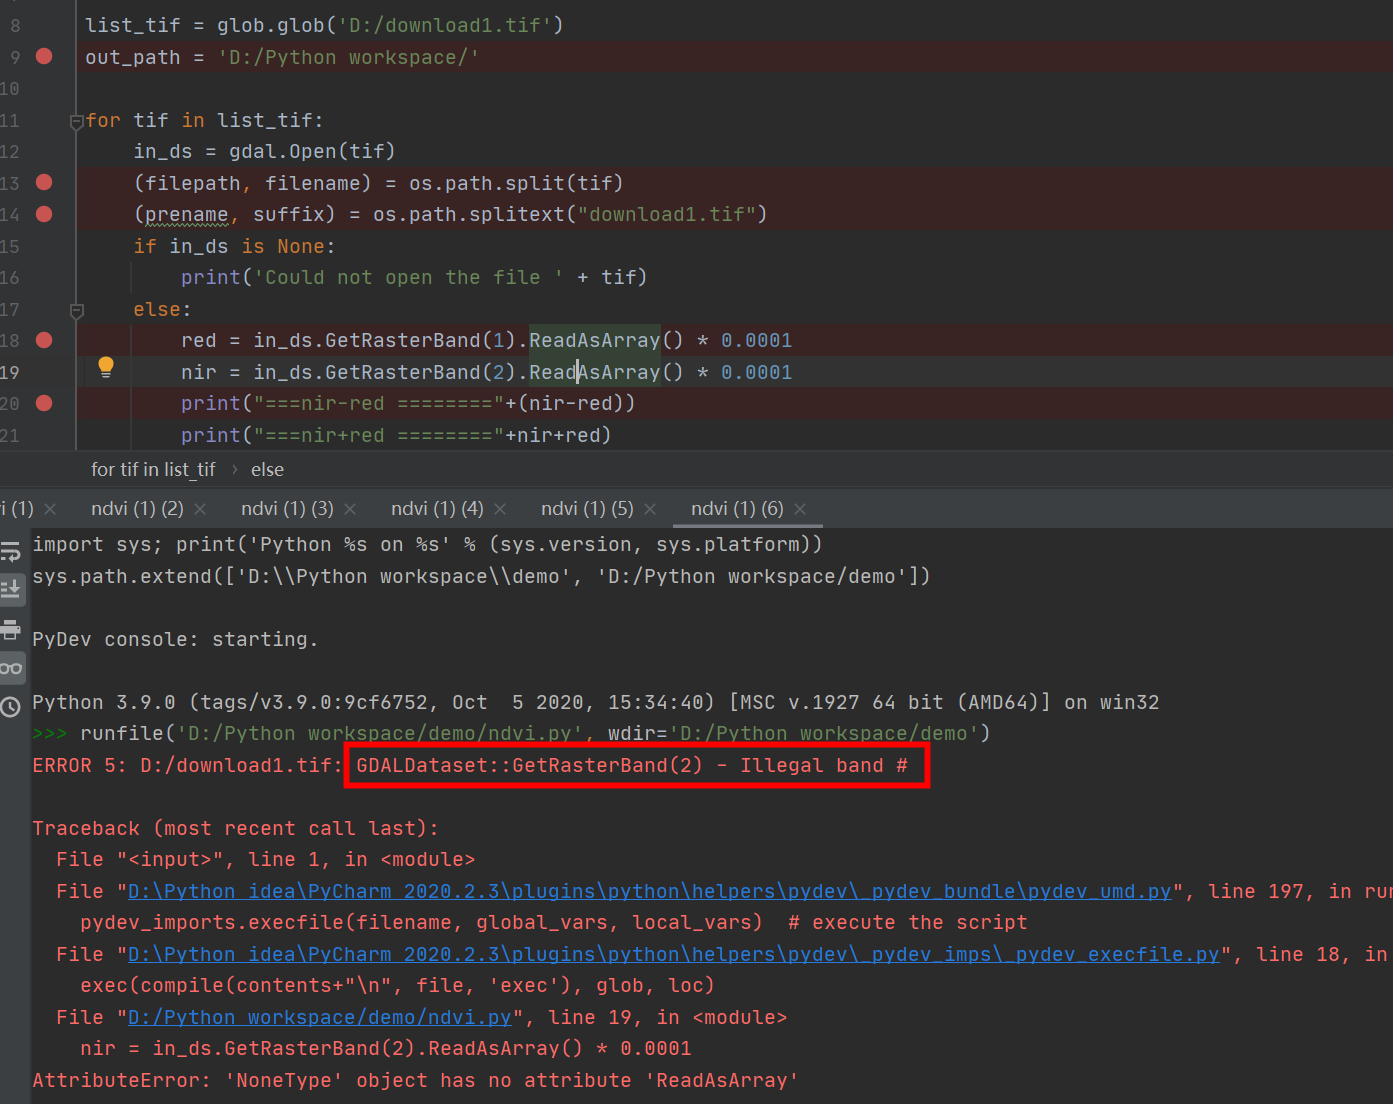
Use Python to extract NDVI data in tiff. When reading the data, an error appears, as shown in the following screenshot
Do you have any suggestions?
Yes, since sentinel 2 has a revisit time of 5 days see here so there are no images for certain dates
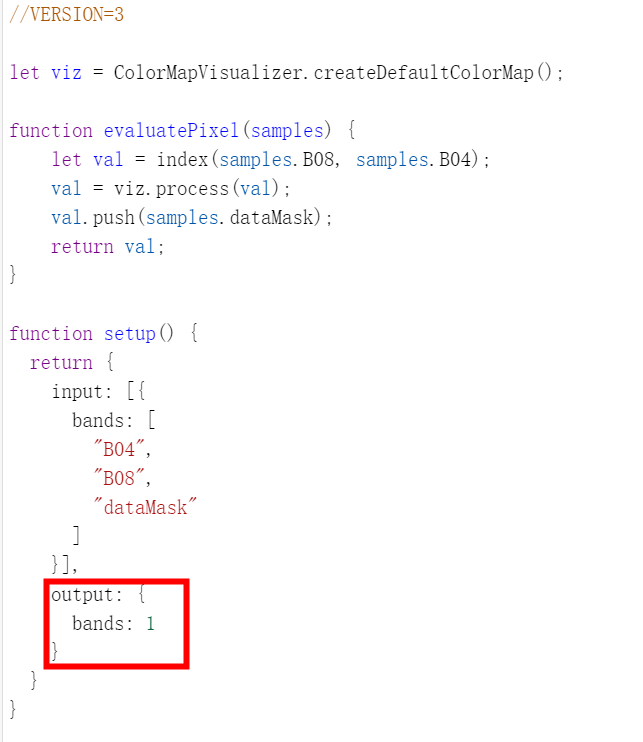
The evalscript that you used above does return 1 output band, but it is not the exact NDVI values that you need, it is just a visualization band . You can see this from your evaluatePixel() function. See the doumentation for the colormap visualizer here
To get the exact NDVI values that you need, just paste the evalscript below to your configuration
The tiff image that you download with this Exact NDVI values using a floating point GeoTIFF API request , has only 1 band which is the NDVI band not 2, thats why you get the error when you try to read a second band.
Have a look at sentinel hub python package there are nice examples to follow, if you may want to use the python package instead.
Hi @dorothyrono ,
I tried the script that you used to get the NDVI values, and I can get the data. We have also checked the correctness of the data and everything looks good. Thank you for your help.