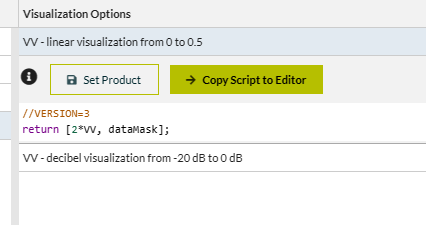
I’ve been trying to visualize a specific band of a satellite imagery by modifying the evalscript in configuration utility. For example, I acquired just the ‘VV’ band of a SAR image. There are two templates (base products) provided there: (1) VV - linear visualization from 0 to 0.5, and (2) VV - decibel visualization from -20 dB to 0 dB. Both the methods seem to stretch the VV band quite simply. However, I could only see a black background image when I check the ‘preview’. I tried to stretch it more using VV*4 or using a higher scaler. It didn’t work. I was also thinking if this is because the preview needs a three-band 8-bit image to visualize, such as a standard PNG. But it still did not work when I tried ‘return [VV, VV, VV]’. I was expecting it give me a gray-scale visualization but the resulting preview was still a black background.
My eventual goal is to request such gray-scale image as a PNG and show it in my web map based on Google Map Javascript API. I’m confused because the EO Browser does show a gray-scale VV bands when that visualization seems to reply on a very simple ‘return [VV]’. It just does not work when I set the same (or a similar) script in my configuration.
Thank you for looking into this. I’ve been using the OCG service. The final goal is to construct the image urls dynamically in html. But I would like to test the evalscript to be concatenated with the url. I tried to use the ‘set product’ in configuration utility and used the following script:
Then in the preview model of that SAR layer, I saw black images. However, I checked the utility functions and found a simple solution:
This showed a single band in gray scale successfully.