Hello I need to monitor my farm to see if there has been any deforestation in the last month, rgb images with high or good resolution, and i’m having trouble, can you help me to do the procedure to get what i need?
Here is a KML file of the point that i need the image
Please i need help fast, i received information that there were wood thief deflorestaring my forest
Hi @odilonscaramuzza ,
Looking at your polygon, I’d suggest using the EO Browser to obtain RGB scenes over the past month and in the future.
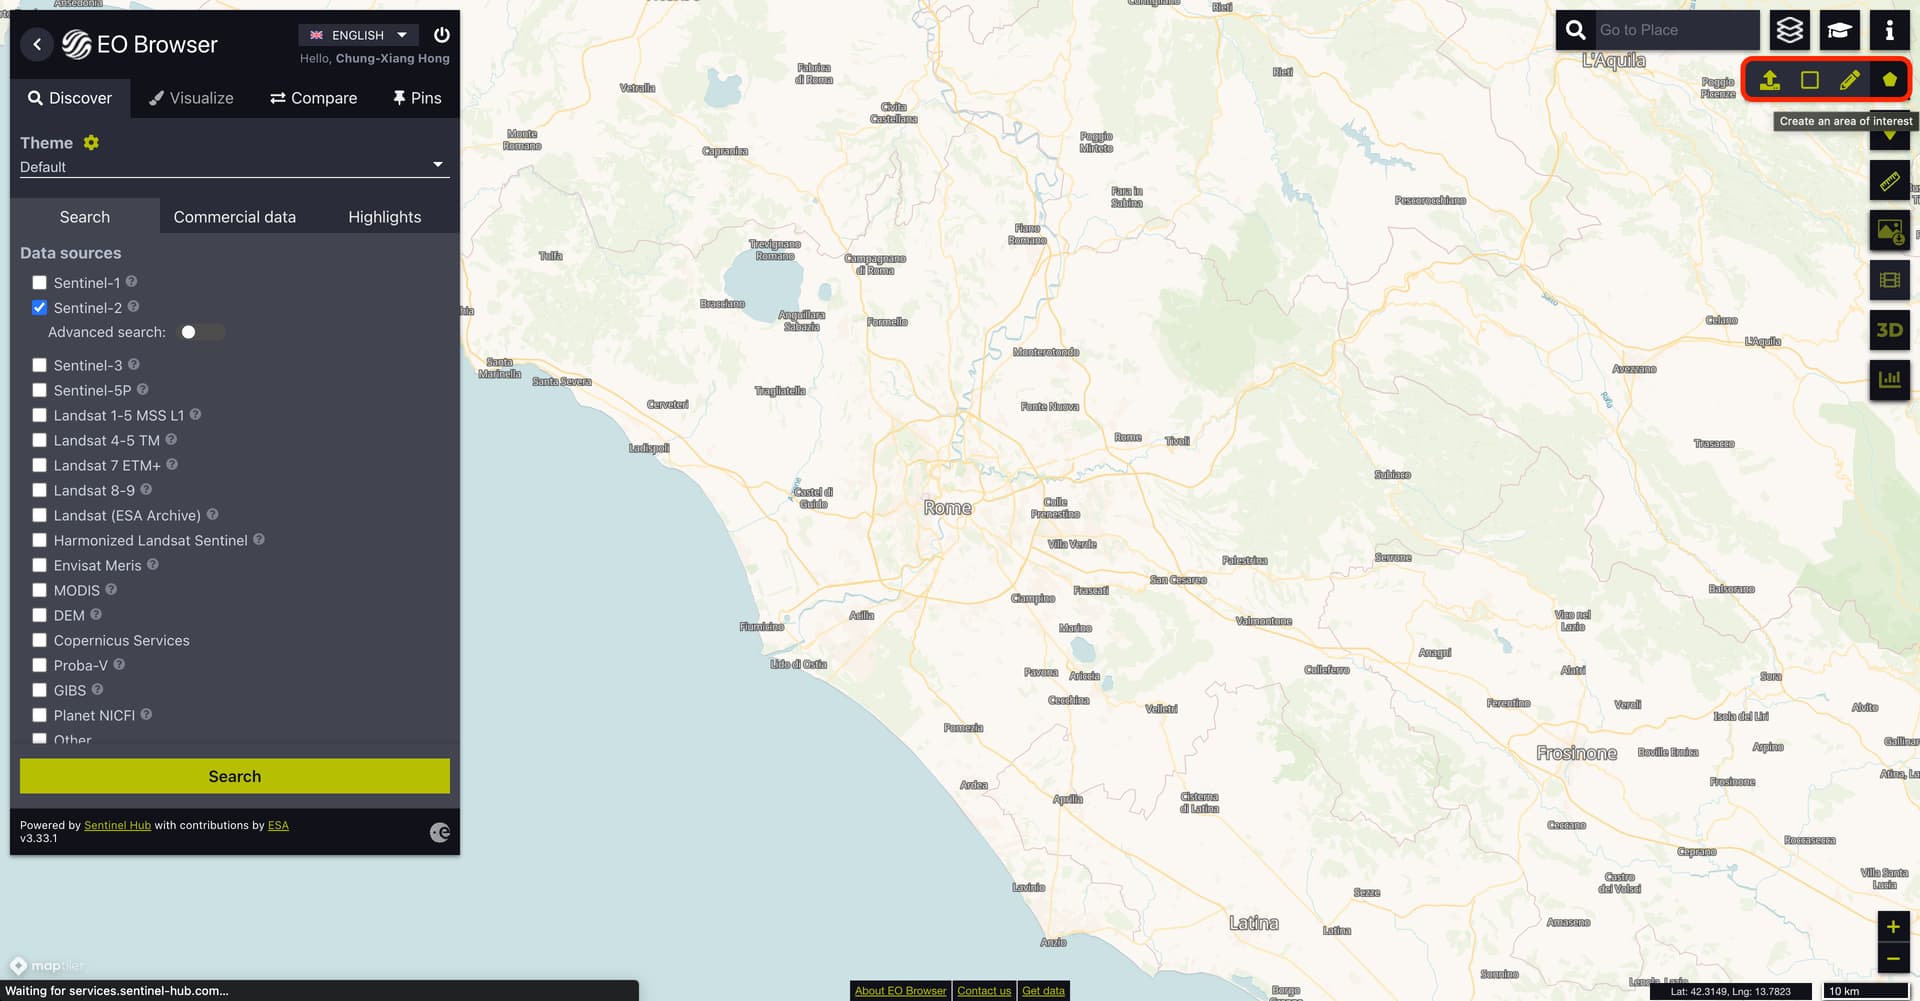
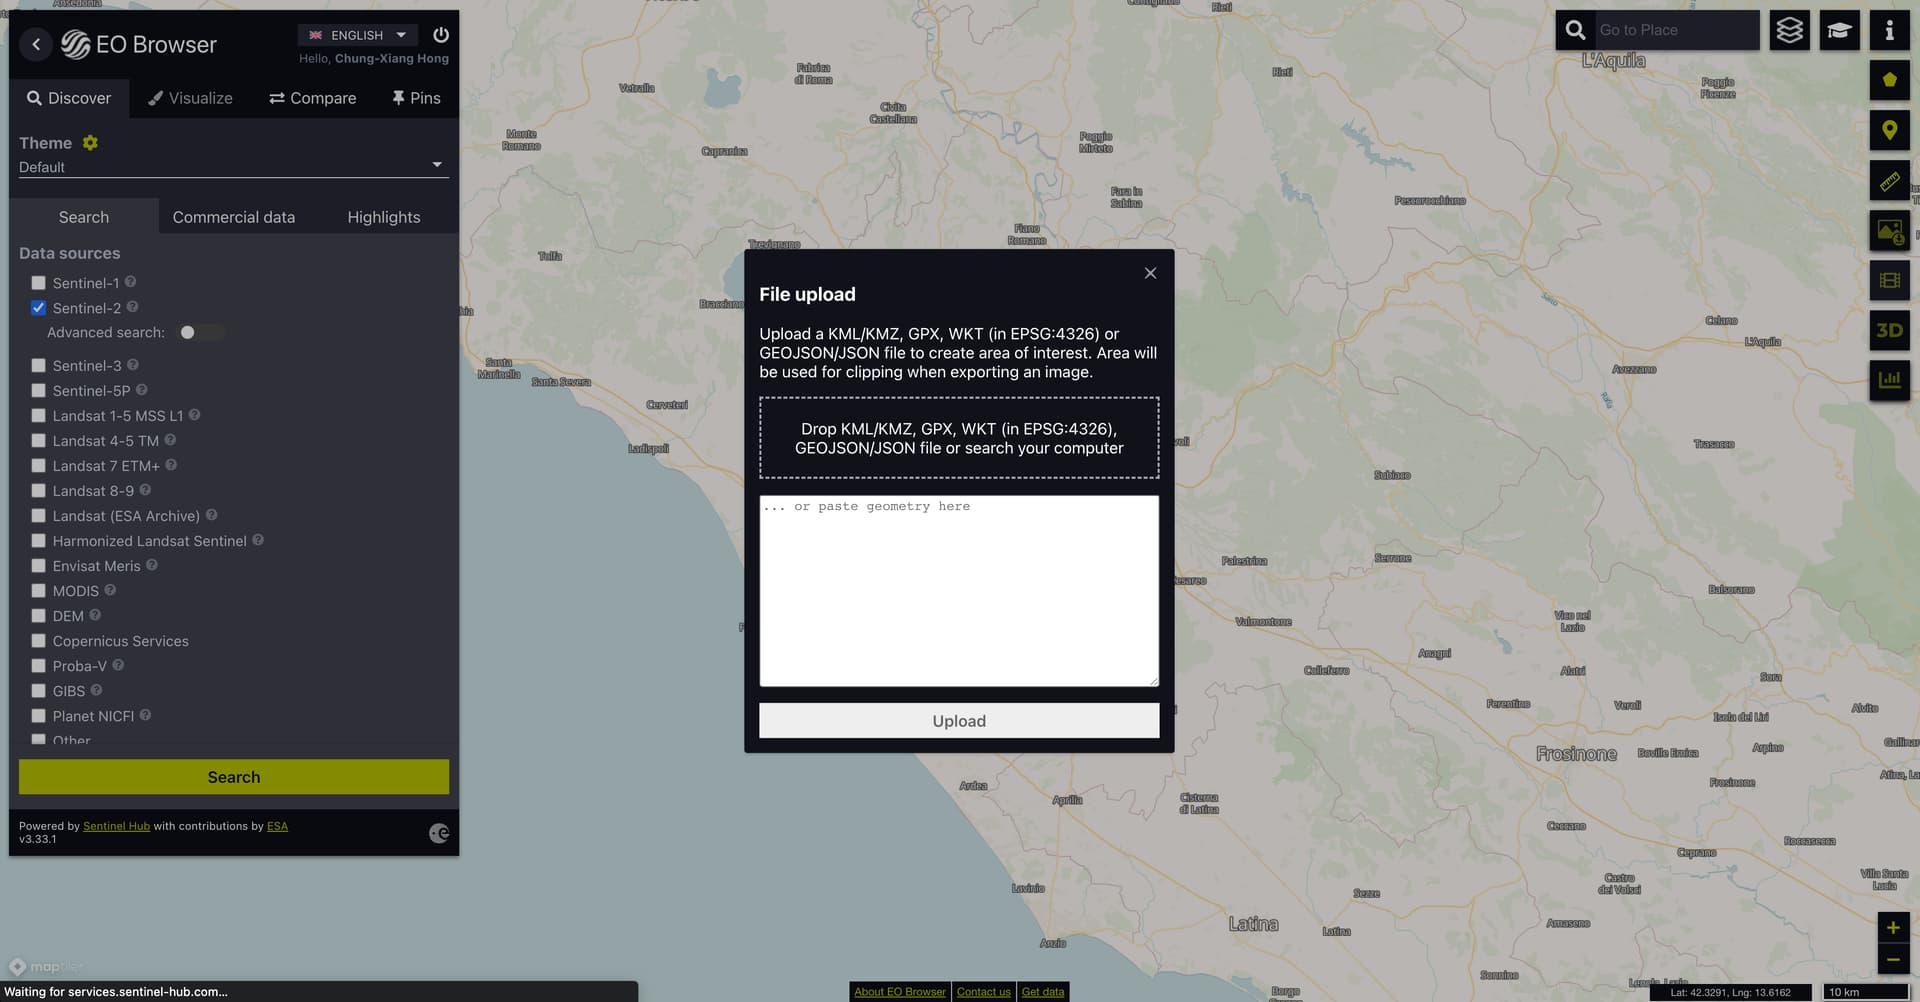
When you’re on the landing page of EO Browser, you’ll see the pentagon icon on the top right corner (Fig 1). By clicking the icon, you can click the first button from the left, which allows you to upload your KMZ file (Fig 2).
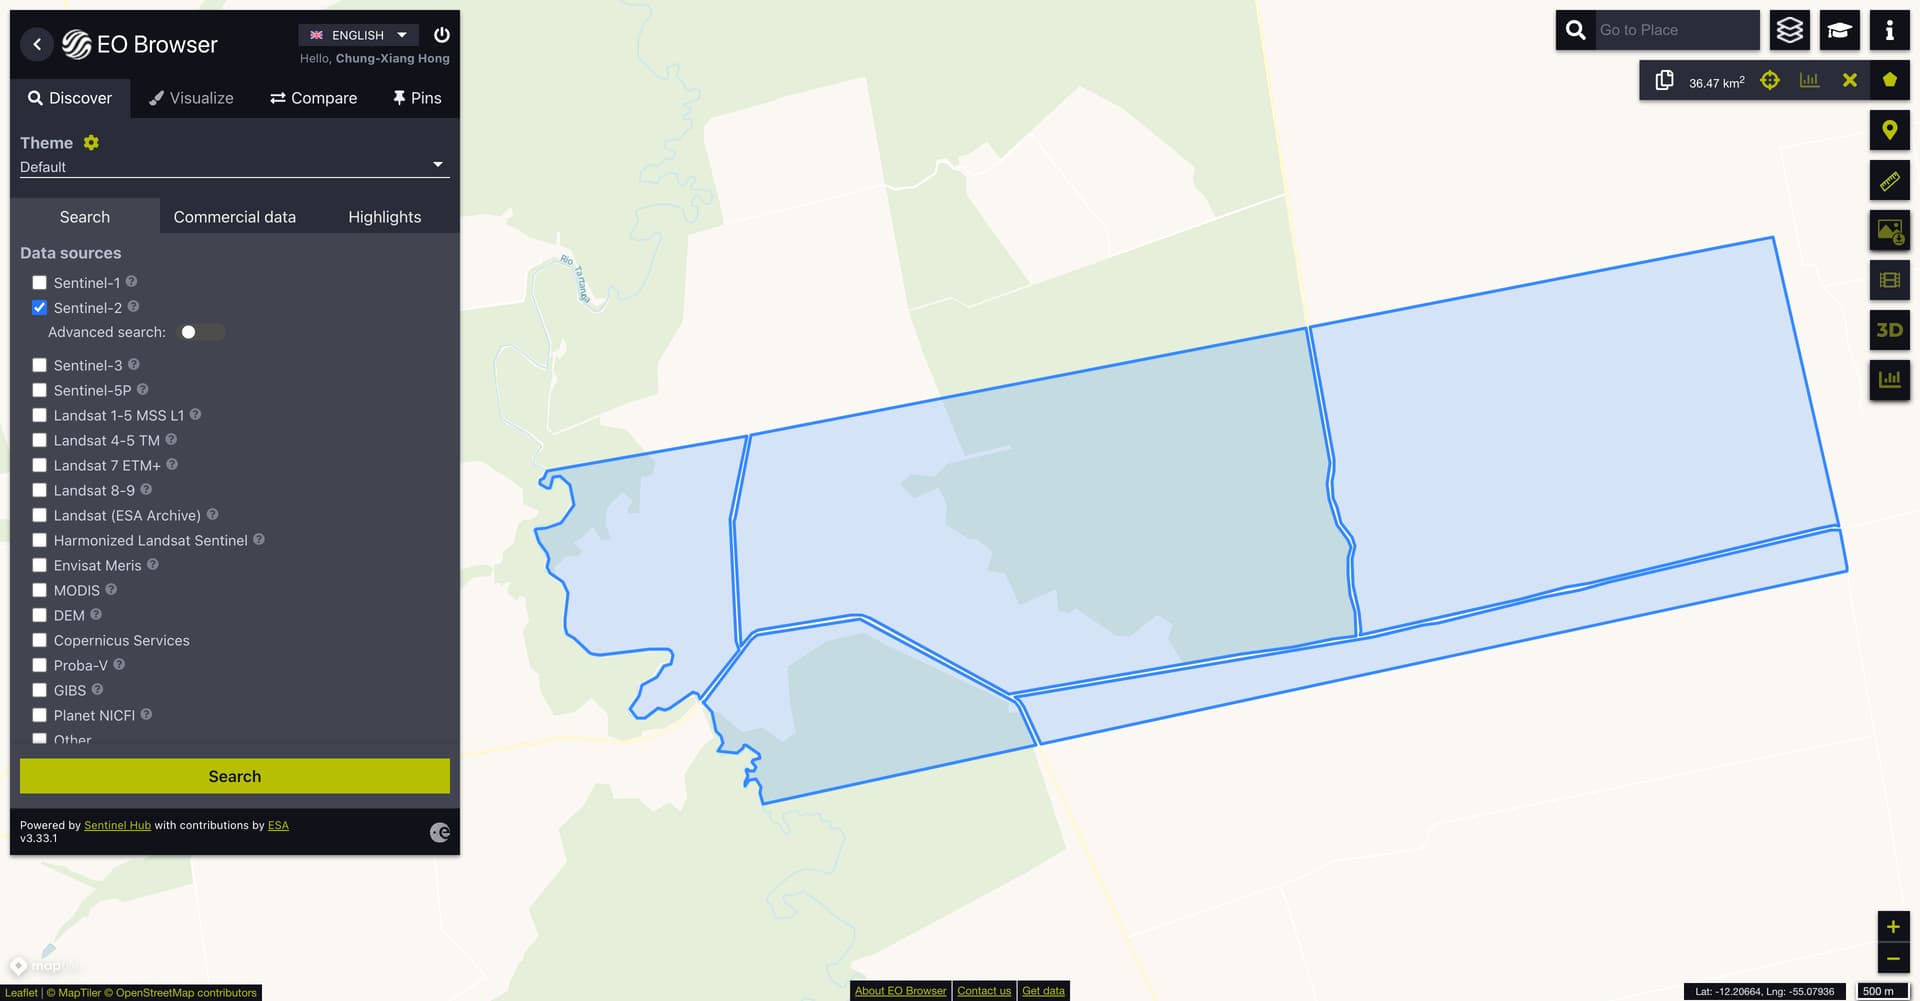
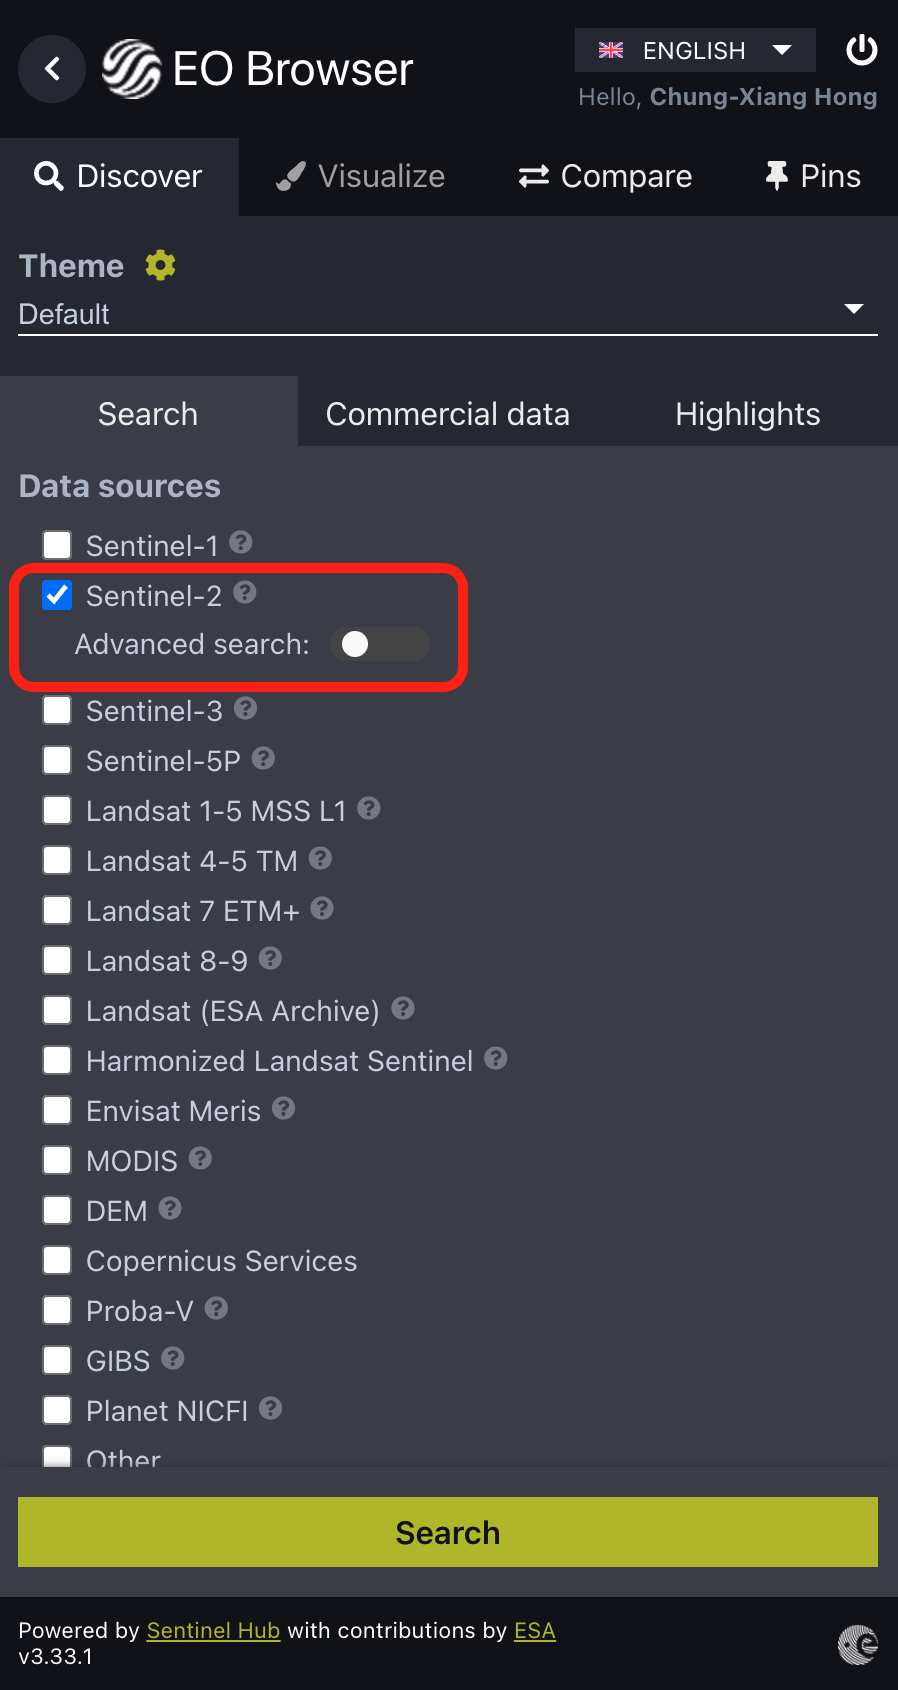
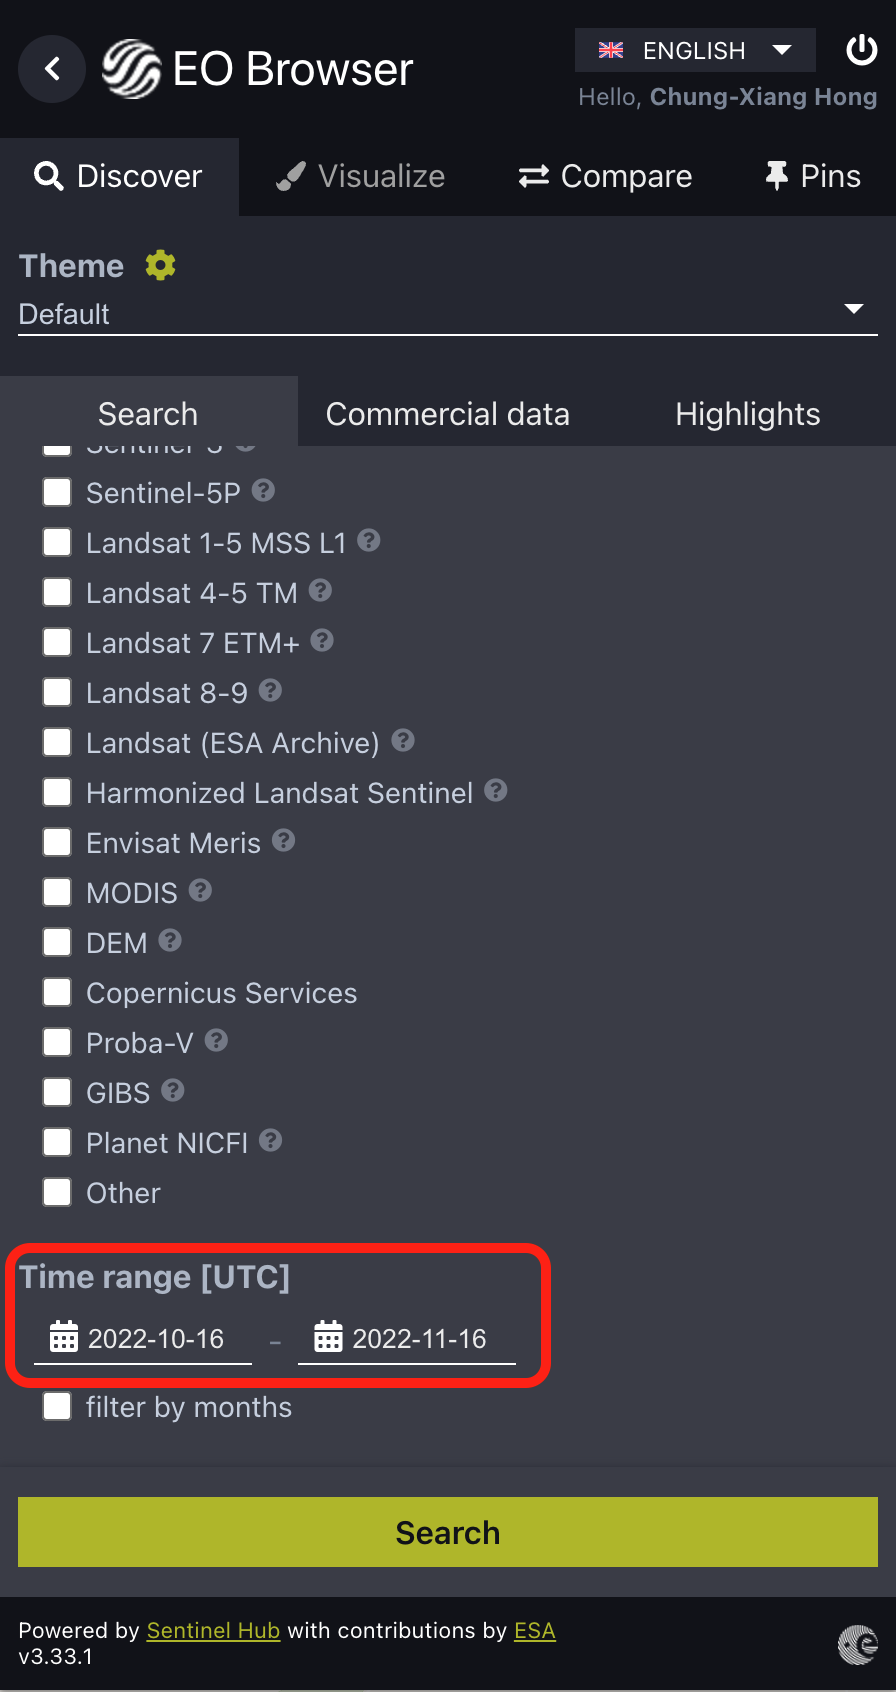
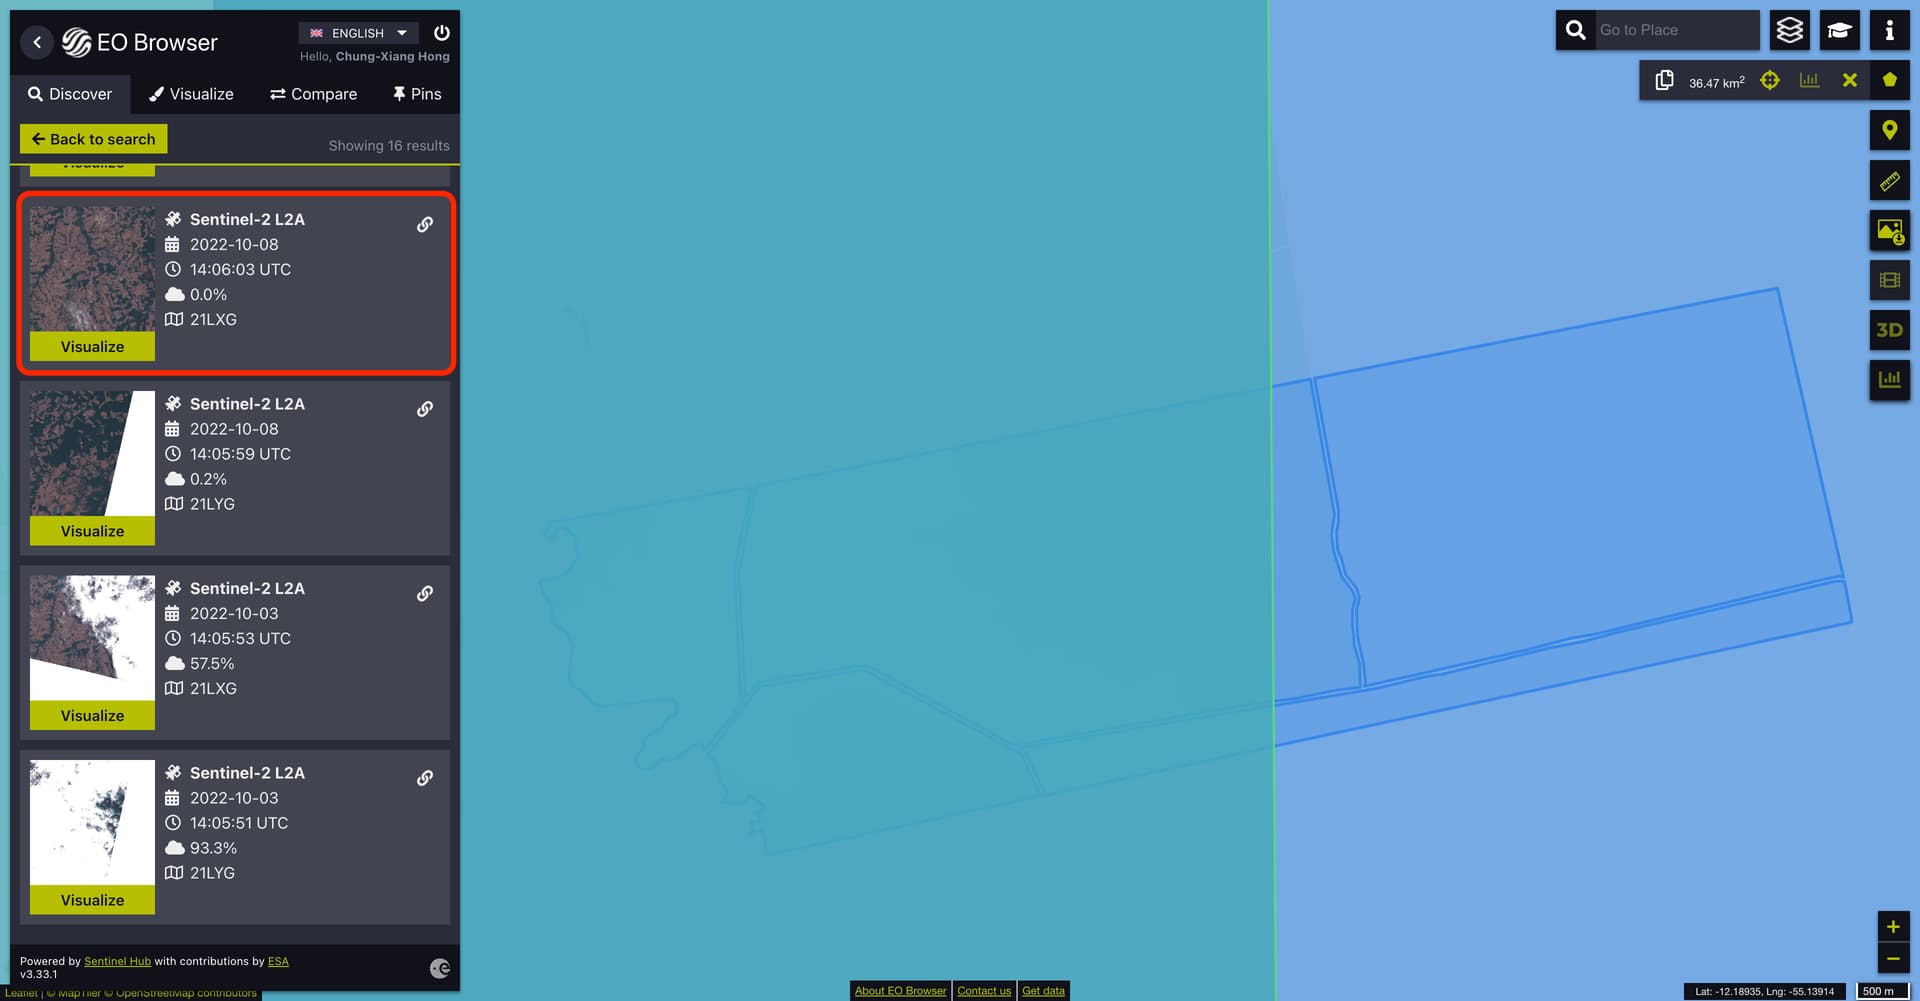
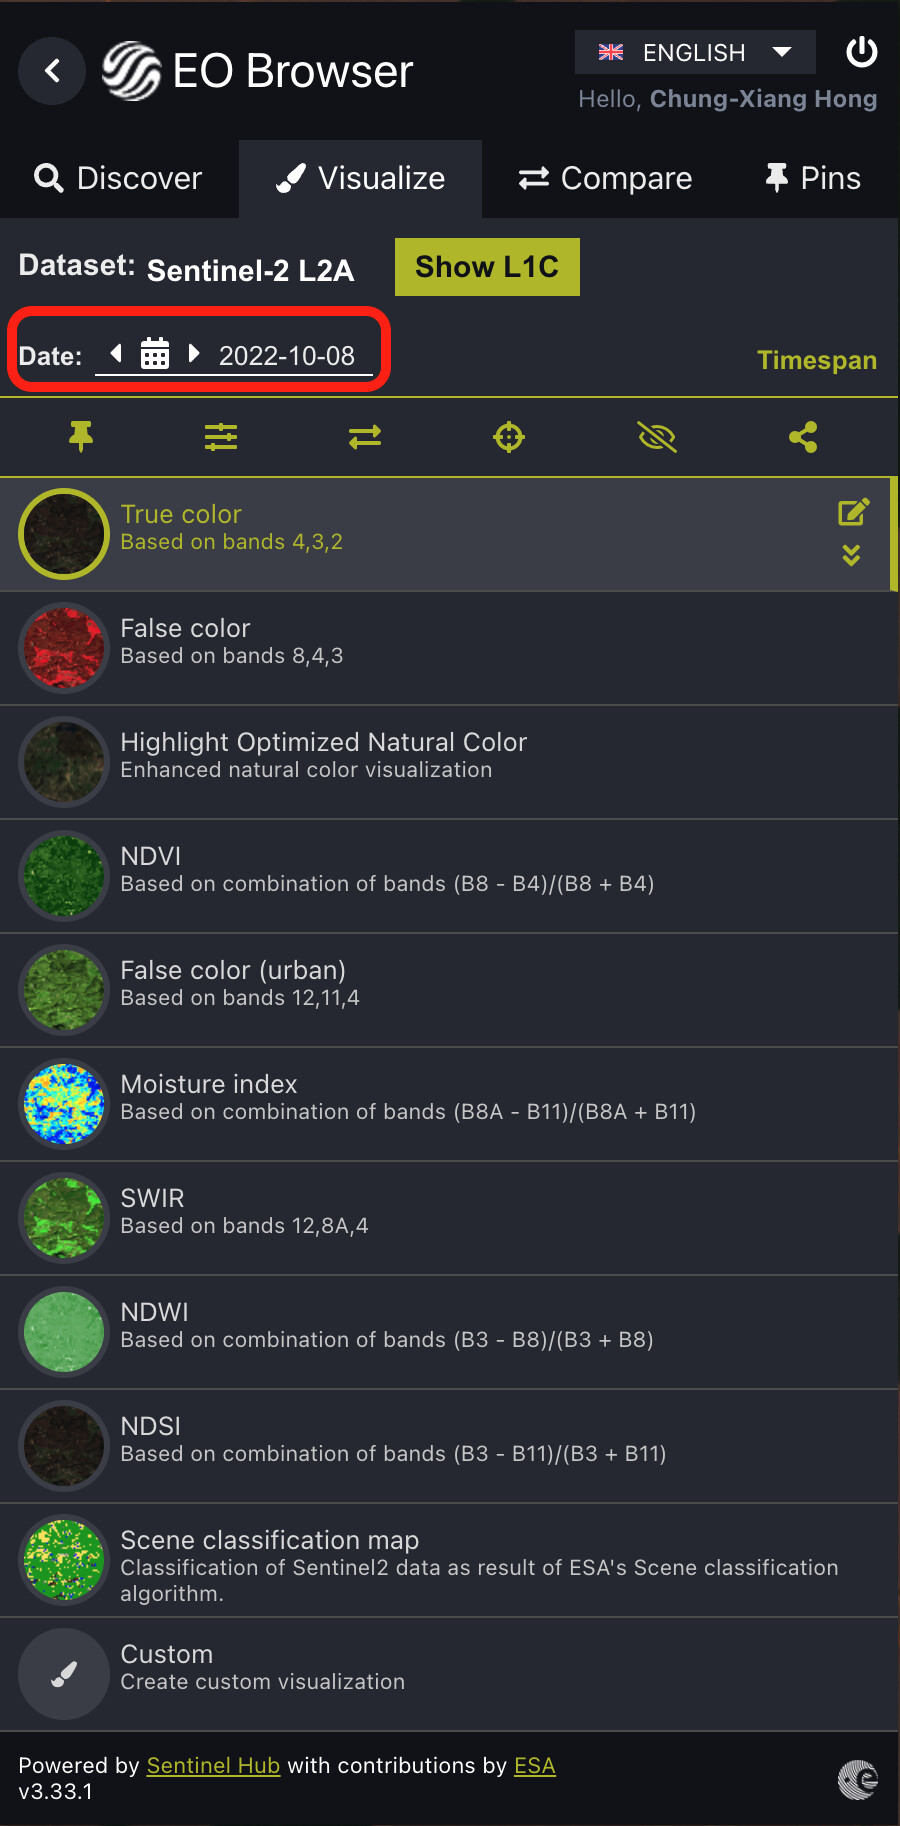
EO Browser will take you to the location of your polygon (Fig 3), from here you can search Sentinel-2 data (Fig 4). To set a time range for searching, scroll down the panel a little bit to find out the field of Time range where you can specify a time range you are interested in (Fig 5). Lastly, select a tile to visualise from the search result (Fig 6). You could also view images from different dates by clicking the calendar on the top (Fig 7). Here is a scene from 2022-10-08 over your farm which is not covered by clouds.
Note that Sentinel-2 has a revisit time of 5 days and your area may be covered by clouds due to weather condition. The resolution of Sentinel-2 data is 10 meters. For satellite imagery with higher resolution, there’s commercial data which you can get it with some costs.
For more details about the data, please take a look at the Sentinel-2 documentation. I would also suggest going through the EO Browser webinar to learn how to use EO Browser.
Fig 1
Fig 2
Fig 3
Fig 4
Fig 5
Fig 6
Fig 7
To add to Chung’s message, you could also consider looking at Sentinel-1 SAR data.
Although the images are a bit harder to interpret, they are not affected by cloud cover (SAR can “see through clouds”) and there are some methods for estimating deforestation: for example we have a custom script that you can visualise in EO Browser and adapt to your area. For a quick idea, just looking at the VV band can work too.