Hello,
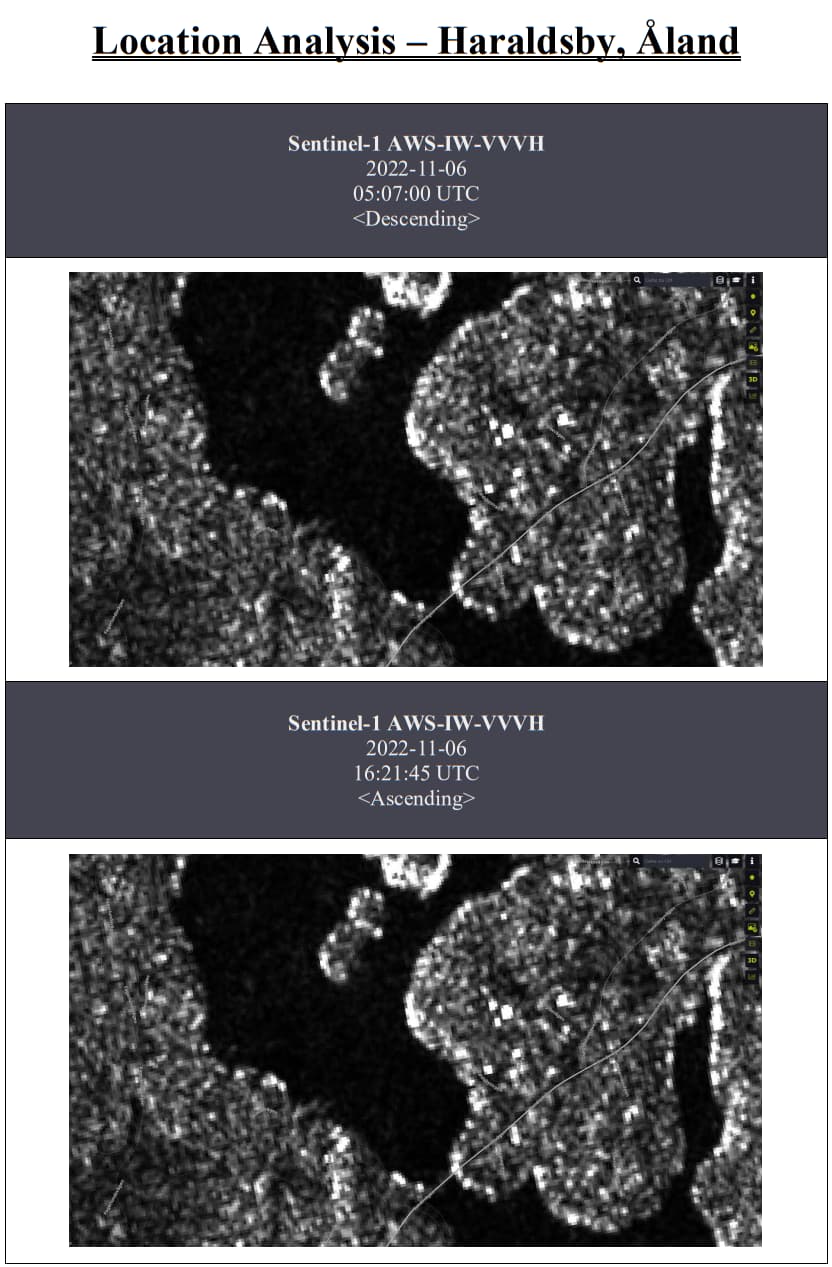
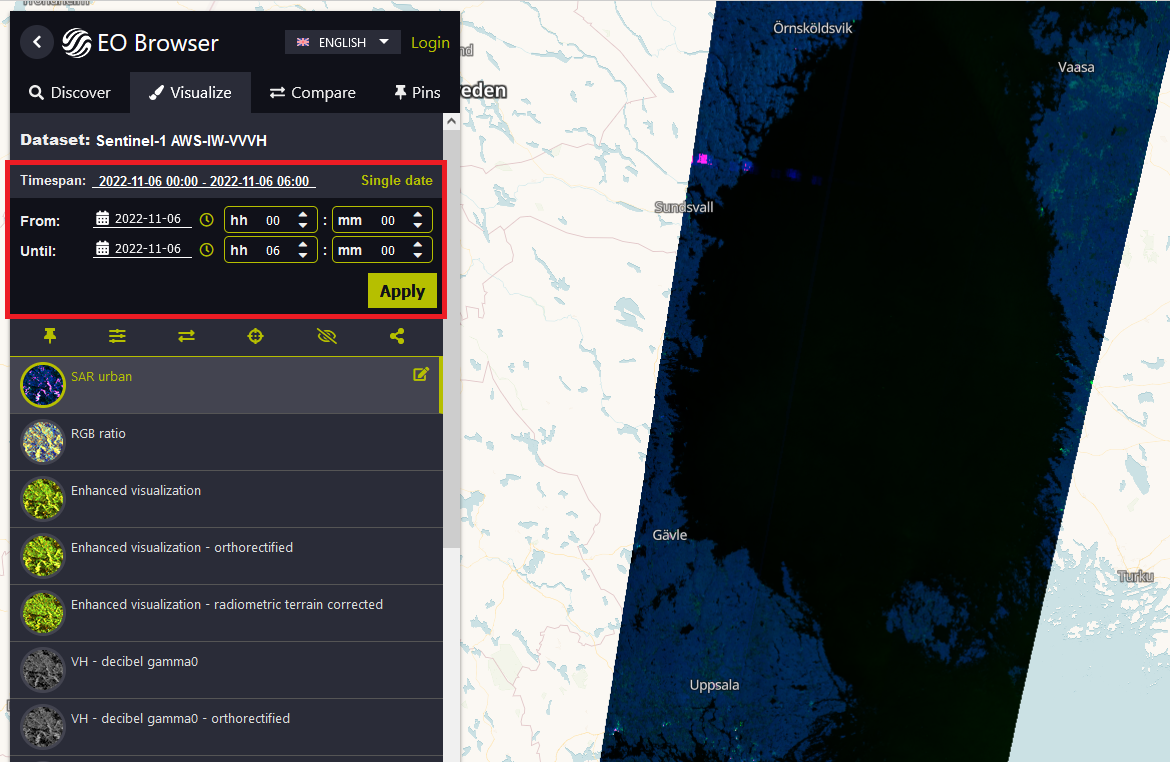
I am currently evaluating different locations in the Finnish and Swedish area, for which I need the SAR images. Now, unfortunately, I have encountered a problem, because for almost all observation points the descending data cannot be displayed (Not even when I explicitly display them). If you click on the data package of the descending observations, only the identical representation comes, which could be observed already with the Ascending mode on the same day. By means of an example near the place “Haraldsby, Åland” I visualized this (see appendix: “Figure 1: Ascending & Descending close-up images”).
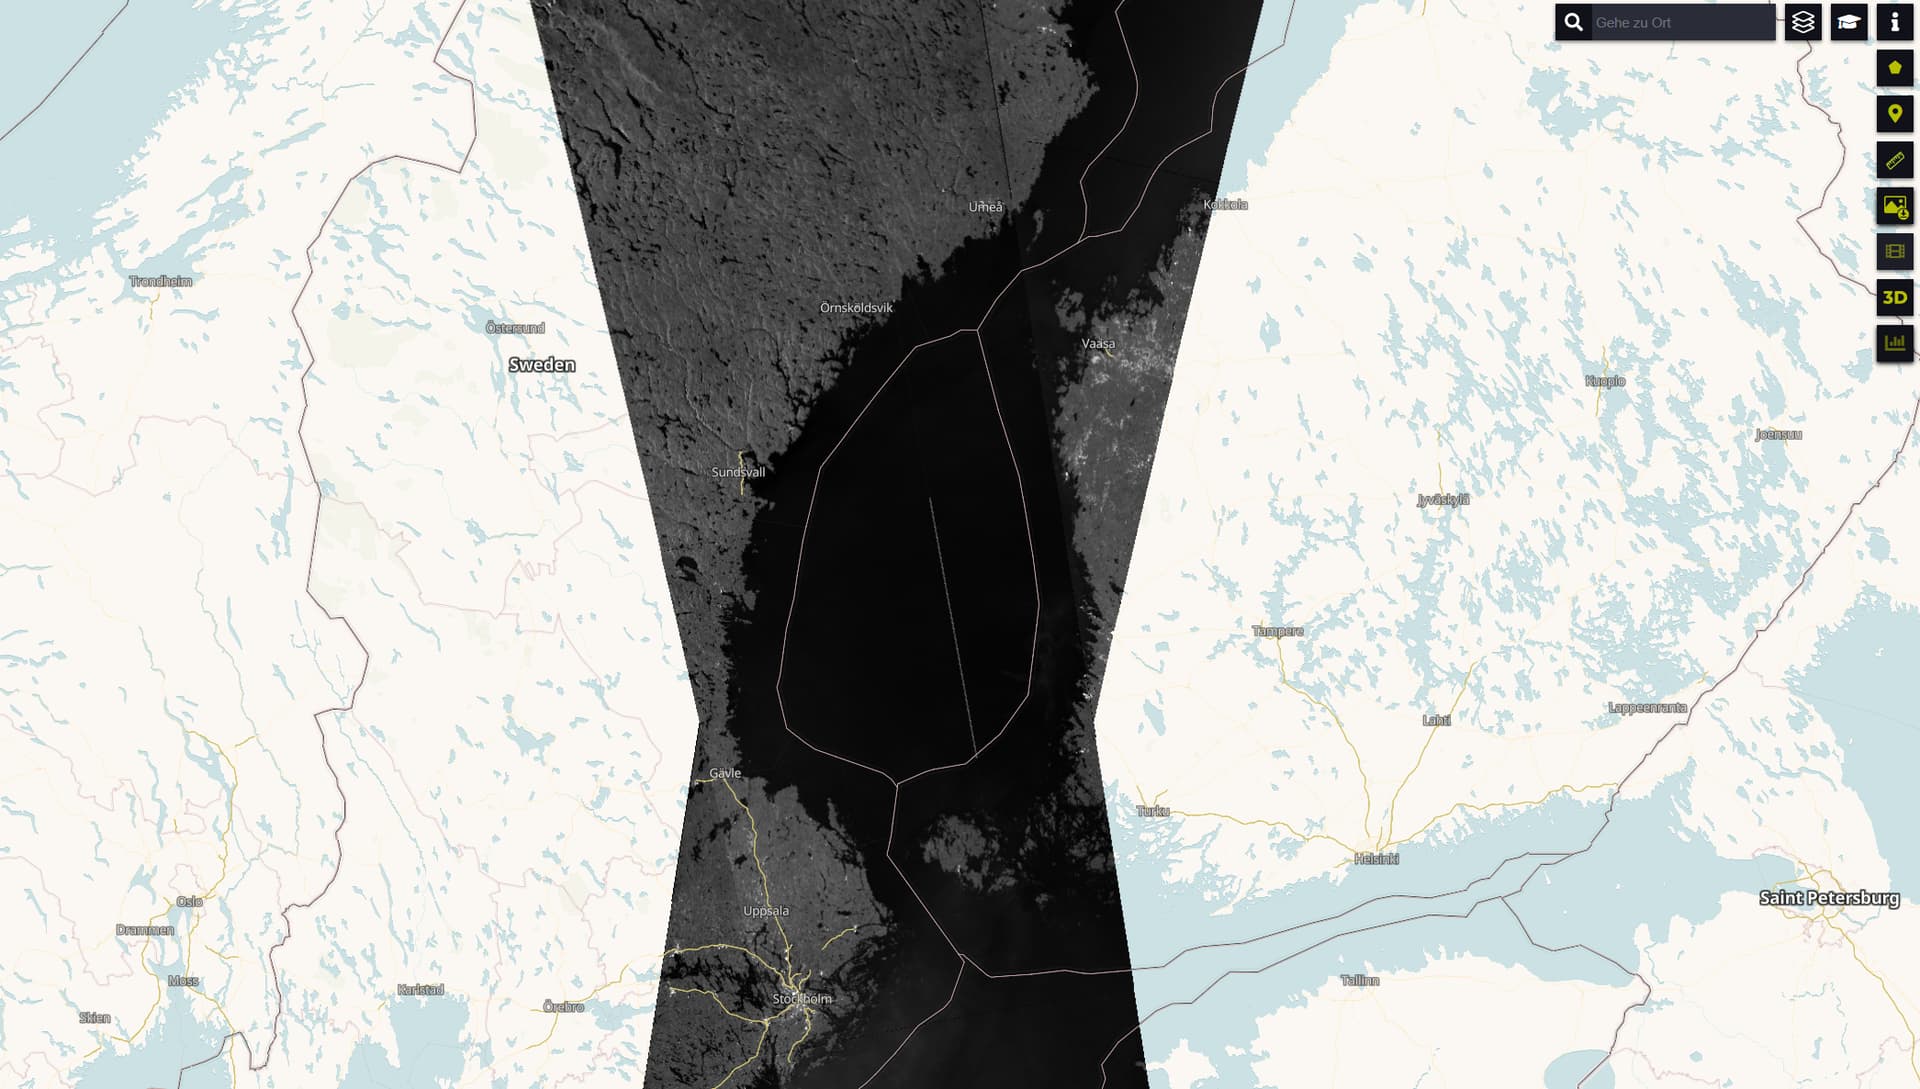
I also have a guess in this respect. If you zoom out (see appendix: “Figure 2: Overlap Area” (again for the location “Haraldsby, Åland”)) you can see that the ascending and descending stripes overlap. Exactly in this overlapping area the descending data can’t be recognized, but outside it is possible again! Now I wanted to inquire, what can be done there, since a progress in my project needs the correct representation.
Thanks for your help in advance!
Best regards,
Simon