Is the SentinelData always in UTM coords?

Hi together,
I am a bit newer to Sentinell and can’t find anything on this topic: If I request an image with a BBox (so a rectangle) I receive a rectangular image but it’s only ‘really’ rectangular in the UTM coordinate system. For starters, is this true? And if so, is there a way of getting it rectangular in e.g. WGS84? (By a server/manuel transformation - goal is to use linear transformation between pixels and coords).

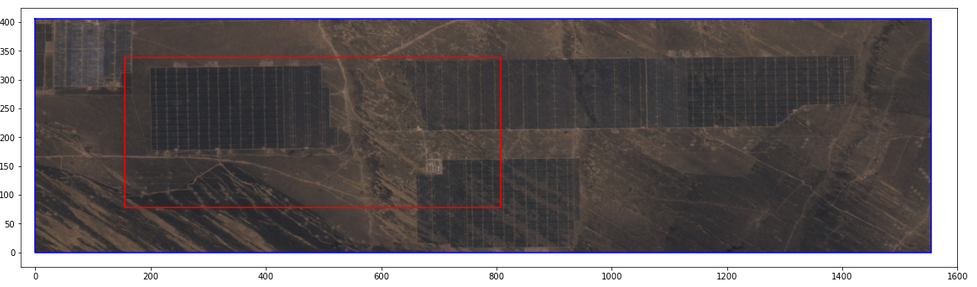
I took a rectangle in WGS84 and used the two corners of it for the bbox. Then I plotted in the original rectangle (via geo_utils) and receive this image.

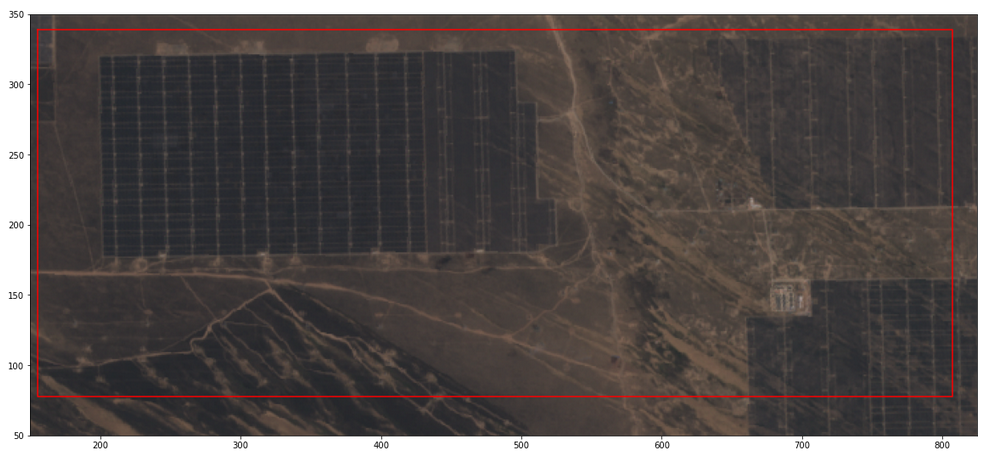
We see that the shape slightly changed and doesnt fit in as a whole. If we extend the bbox a bit we get:

Since I used a tool to draw a polygon the lines could be (and propably are) curved. In contrast if I just use the bbox corners in UTM (and calculate the other two corners manually) the image fits perfectly, supporting my claim.

Is there some documentation about it? It says, that the data is originally in UTM but I specified to download it in WGS84.

Thank you for your help.
Best regards
David and Stephan

Hi David and Stephan,

It’s a bit hard to say without knowing the steps you performed. Would it be possible for you to share:

  • the original rectangle in WGS84
  • how you queried the image (you specified a bounding box in WGS84?)
  • how you plot the bounds and what you actually plot
  • the conversion step that you do (using geo_utils)?

Those elements should be enough to understand your approach here. The reason I’m asking is because you should get back a rectangular image in WGS84.

Hi,
of course.
The rectangle is given by: [[100.4367, 36.0094], [100.4367, 36.0355], [100.5019, 36.0355], [100.5019, 36.0094]].
My bounding box is therefor: BBox([100.4212, 36.0027, 100.57674, 36.0433], crs=CRS.WGS84).

Then I convert the points of the rectangle from WGS84 into pixel-coordinates with geo_utils.wgs84_to_pixel. (Before I acquire the necessary transformation vector and UTM-zone with geo_utils.to_utm_bbox and bbox.get_transform_vector).
From here I plot the polygon with cv2.polylines, which just takes the corners of a polygon as input.

I took a bit of time to answer because I had to check a few functions. I am still missing some information about your process, but we can go through the steps to obtain the transformation that (I think) you want in order to clarify the steps.

I think the fact that you are not getting a rectangle from the pixel coordinates could come from the in-built functions that you are using: they are making you transform the coordinates several times and go via UTM. @maleksandrov can correct me if I’m wrong.

If you want a linear transformation to pixel coordinates, I would do the following:

Starting with your bounding box: BBox([100.4212, 36.0027, 100.57674, 36.0433], crs=CRS.WGS84) (by the way it is different from the rectangle you specified in your previous post), we fetch the transform:

resx = 0.0001
resy = 0.0001
my_trans = my_bbox.get_transform_vector(resx, resy)

Note that here we have to specify the resolution in the CRS of the BBox. This means that we aren’t getting exactly square 10*10m pixels but an approximation. For a better control of the resolution, I would switch to a projection with units in meters (such as UTM). This also means that you will have to use the resolution parameter in your SentinelHubRequest in order to stay consistent:

request_true_color = SentinelHubRequest(
    evalscript=evalscript_true_color,
    input_data=[
        SentinelHubRequest.input_data(
            data_collection=DataCollection.SENTINEL2_L1C,
            time_interval=('2021-08-28', '2021-08-28'),
        )
    ],
    responses=[
        SentinelHubRequest.output_response('default', MimeType.TIFF)
    ],
    bbox=my_bbox,
    resolution=(resx, resy),
    config=config,)

Then we can do a direct transformation from WGS84 coordinates to pixels using the my_trans variable (modified from SE):

def pixel_coords(lon, lat, trans):
    xOrigin = trans[0]
    yOrigin = trans[3]
    pixelWidth = trans[1]
    pixelHeight = -trans[5]

    col = int((lon - xOrigin) / pixelWidth)
    row = int((yOrigin - lat ) / pixelHeight)
    
    return col, row

If we plot the image with your rectangle in red and the bounds of the BBox in blue, we obtain the following:

and a zoom on the Bbox:

I hope this helps, or at least gets the ideas flowing :wink:

1 Like

Thank you for your detailed answer Maxim, this really helped.
Do you know why the inbuilt functions for WGS84 use the UTM transformations if it isn’t needed at all? And one last question regarding the resolution: I always assumed i can write it in meter/pixel (e.g. 10 for color bands) but how do I have to change it for WGS84 like you did here?

The team behind the package can confirm, but I think the functions were developed for the large area utility which uses UTM zones (before Batch Processing came along).

As for the specification of the resolution in your requests, there are two solutions:

use the size parameter:

You can use image size rather than resolution, and calculate the size from the resolution (see here). In this case, the resolution set is in meters:

betsiboka_coords_wgs84 = [46.16, -16.15, 46.51, -15.58]
resolution = 60  ## Resolution in meters in this case
betsiboka_bbox = BBox(bbox=betsiboka_coords_wgs84, crs=CRS.WGS84)
betsiboka_size = bbox_to_dimensions(betsiboka_bbox, resolution=resolution)

print(f'Image shape at {resolution} m resolution: {betsiboka_size} pixels')

and in the request:

request_true_color = SentinelHubRequest(
    evalscript=evalscript_true_color,
    input_data=[
        SentinelHubRequest.input_data(
            data_collection=DataCollection.SENTINEL2_L1C,
            time_interval=('2020-06-12', '2020-06-13'),
        )
    ],
    responses=[
        SentinelHubRequest.output_response('default', MimeType.PNG)
    ],
    bbox=betsiboka_bbox,
    size=betsiboka_size,
    config=config
)

use the resolution parameter:

As you can see in the docs, the resolution parameter in the SentinelHubRequest should be “in units compatible with the given CRS”. For an example of this approach, see my previous post.

Now to come back to our previous subject, you would have to use the resolution parameter in WGS84 or use a different projection in meters. This is because you need to set the resolution in the CRS of the Bbox in order to get the geotransform parameters (unless you fetch them from the downloaded tiff yourself).

Ok, this answers all my questions. Thanks again for the nice explanations!

1 Like