Issue with identifying ndvi values using qgis

HI,

I am currently working on a project that needs average NDVI values of zipcodes across the US.
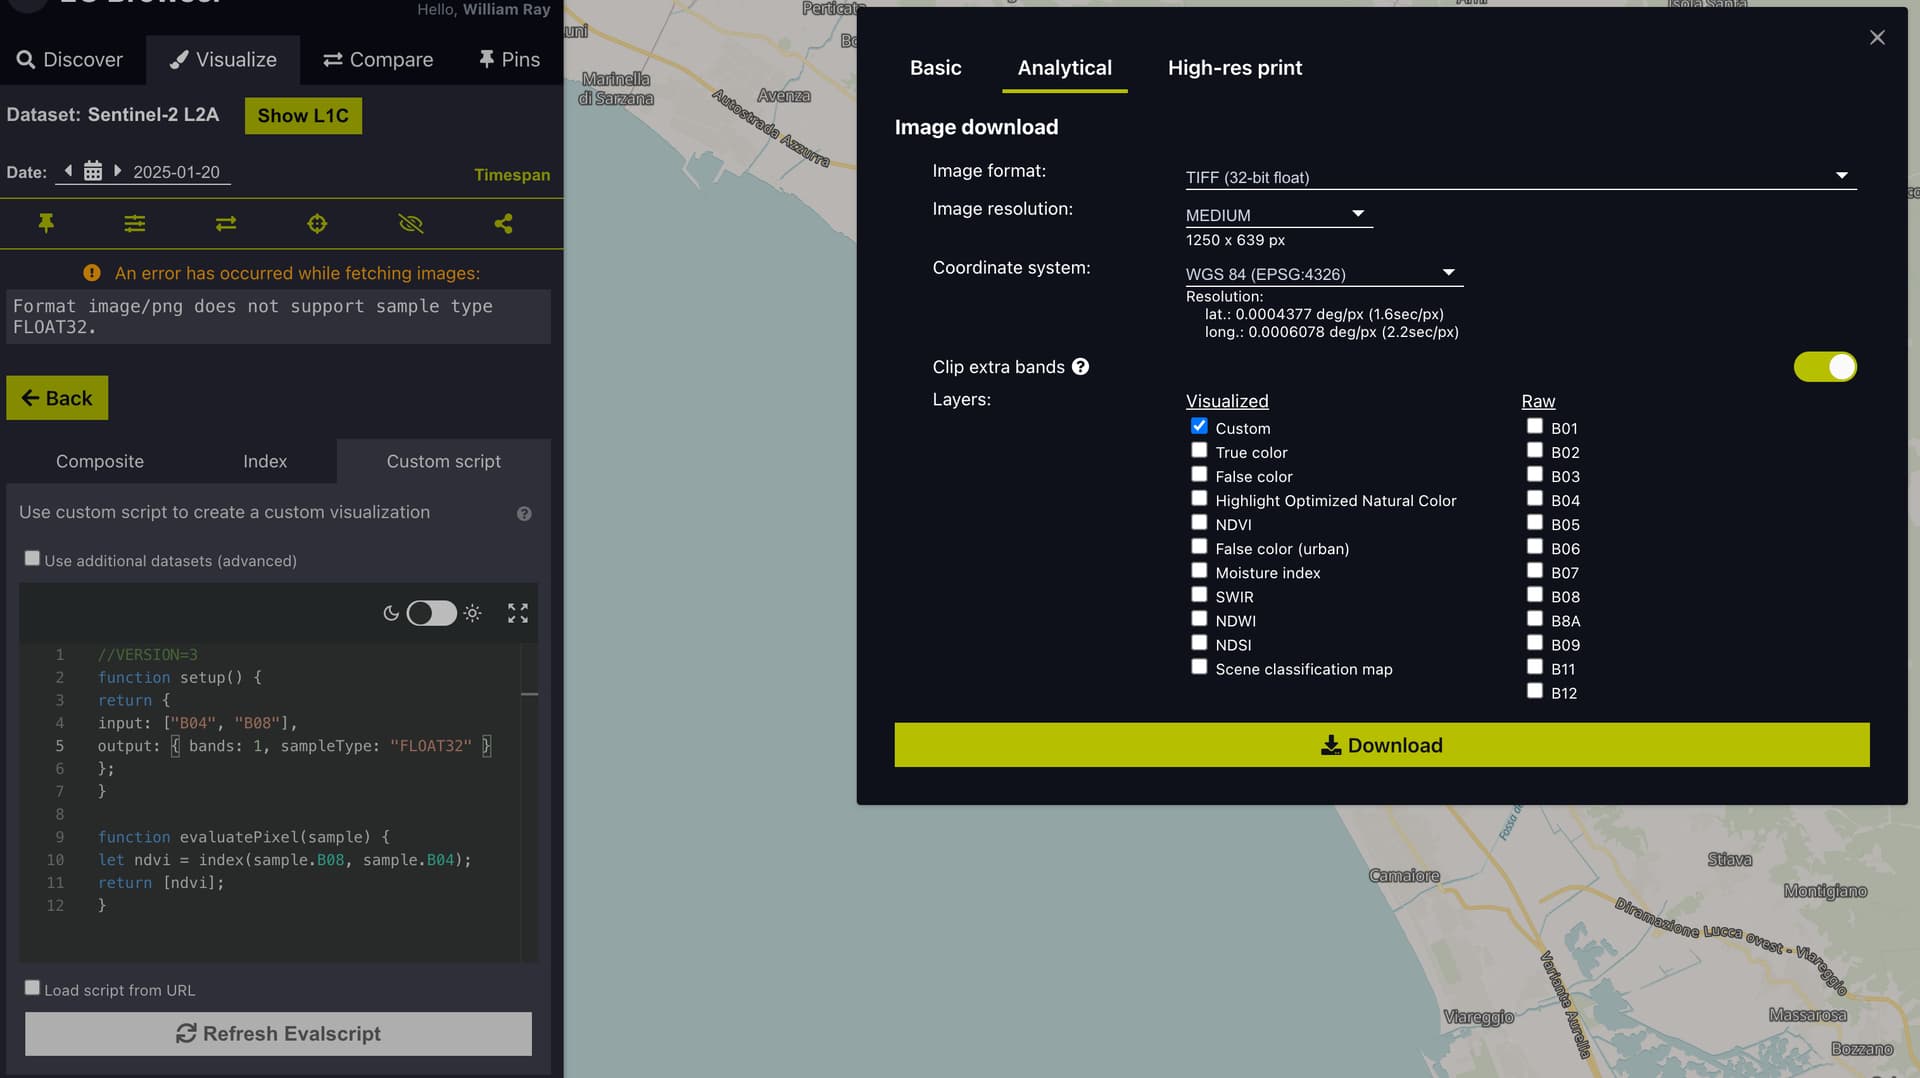
When I download images from sentinal hub (sentinal 2, geotiff 32bitt, custom 10x 10 y). I then open it on my QGIS account.

I find two issues, one is that the scale is from 0-1, I know how to use the raster calculator and by doing this expression: (“NDVI_Layer@1” * 2) - 1 the scale would be -1 to 1.

My real issue though is that when i use the identify feature tool and hover over the image (whether it is the original or the rescaled). I get wrong values, areas of vegetation are -1, and the average ndvi value of an area would be -0.2 when i know that the most frequent values should be around 0.4-0.6.

So, my question is what is the easiest way to download NDVI values and then open them on qgis? I do not want to export individual bands, i just want the ndvi image to be correct when i open it on qgis. The crs i use is 4326.

Hi Fatma, Please can you share the request (or screenshot) and the evalscript that is used to calculate NDVI. It sounds like you might be using a visualisation script for analysis but without seeing what you are doing I can only guess.

Hi William,

Thank you for responding! I realized that I was downloading ‘NDVI images’ and not using a custome script to get the NDVI values.

Can you please let me know if my process is correct now?

I used this custom script:
//VERSION=3
function setup() {
return {
input: [“B04”, “B08”],
output: { bands: 1, sampleType: “UINT16” }
};
}

function evaluatePixel(sample) {
let ndvi = index(sample.B08, sample.B04);
return [10000 * ndvi + 10000];
}

Then i re-scaled it to -1 to 1 on qgis using:
(“ndvi_layer” - 10000) / 10000

And then, I reprojected geospatial layers to the ESRI:102003 - USA Contiguous Albers Equal Area Conic coordinate reference system to ensure accurate area calculations. (Area zipcode polygons i downloaded from nhgis were ESRI:102003. Sentinel-2 images with overlapping coverage were merged into a single raster layer, which was subsequently clipped to the boundaries of each polygon. Mean NDVI values were calculated for each area using the zonal statistics tool in QGIS, integrating raster-based data with vector polygons for area-specific statistical analysis (the mean from zonal statistics)

It is my first time doing this for a research project so I would be grateful for your input! Thank you.

Hi,

  1. You should be using FLOAT32 as your Sample Type in your output. You cannot obtain NDVI values with UNIT16 as this will only output unsigned integers and not float values which spectral indices require.
  2. You can remove your scaling calculations after this. You don’t need to multiply your NDVI output and add 10000 too.

Hi William,
I put this script in and it told me there was an error to obtain images.
//VERSION=3

function setup() {

return {

input: [“B04”, “B08”],

output: { bands: 1, sampleType: “FLOAT32” }

};

}

I was following this forum to use UNIT16

I would appreciate it if you can let me know how the custom script should look like instead. Thanks!

You need an evaluatePixel() function in your script as well as the setup() function.

You can add this:

function evaluatePixel(sample) {
let ndvi = index(sample.B08, sample.B04);
return [ndvi];
}

Hi William,
Thank you for your response, so would the full script look like this?
//VERSION=3
function setup() {
return {
input: [“B04”, “B08”],
output: { bands: 1, sampleType: “FLOAT32” }
};
}

function evaluatePixel(sample) {
let ndvi = index(sample.B08, sample.B04);
return [ndvi];
}

It still gave me an error to obtain the image, I am not sure what I am missing.

Assuming I will be using the right script and then download the images with ESPG:4326 will I then be correct in my strategy if I reproject the layers to ESRI:10200 to fit the polygons CRS from the zipcodes? I would then merge the layers and then clip it to the polygon and run zonal statistics to get the mean (which I assume is the NDVI).

I do appreciate your follow up and look forward to a reply, if it is possible to continue this over email as well I am more than happy to receive guidance as it has been a challenge to ensure my NDVI scores are accurate.

Kind regards,
Fatma

Please can you share the full request Fatma and our team will try and replicate your issue.

Hi William,

Here is the full request: Is the data strategy I used to obtain NDVI values valid once I use the zonal statistics in QGIS?

Method:
I went to sentinal hub and put in a zipcode on the search bar: e.g. 10025
I then when to visual, picked the cloud coverage to 0% and picked a date in november
I then went to custom script at the bottom of the options and types in this code:

//VERSION=3
function setup() {
return {
input: [“B04”, “B08”],
output: { bands: 1, sampleType: “UINT16” }
};
}

function evaluatePixel(sample) {
let ndvi = index(sample.B08, sample.B04);
return [10000 * ndvi + 10000];
}

I then exported it as ESPG:4326 and imported it in sentinal hub.
Then i re-scaled it to -1 to 1 on qgis using:
(“ndvi_layer” - 10000) / 10000

After that, I reprojected the geospatial layers to the ESRI:102003, since my zipcode polygons i downloaded from NHGIS were also ESRI:102003. If I had multiple 0% coverage images I merged them into a single raster layer, which was subsequently clipped to the boundaries of each polygon.

Mean NDVI values were calculated for each area using the zonal statistics tool in QGIS, integrating raster-based data with vector polygons for area-specific statistical analysis (the mean from zonal statistics)

My question is: is my custom script correct? Is my data strategy valid? What exactly is wrong in my steps and how can I rectify it?

You then told me the custom script should be:
//VERSION=3
function setup() {
return {
input: [“B04”, “B08”],
output: { bands: 1, sampleType: “FLOAT32” }
};
}

function evaluatePixel(sample) {
let ndvi = index(sample.B08, sample.B04);
return [ndvi];
}

But there was an error in obtaining the images. I would appreciate the help and any clarity. I need the team to review my data strategy and approve my method so that I can later use my values for research.

Thank you!

By “I went to Sentinel Hub” I assume you mean EO Browser. There looks like there is nothing wrong with the custom script. I would recommend that you make sure your request looks like this when downloading the imagery. You won’t be able to visualise it in EO Browser but the downloaded product should be correct.

However, for downloading analysis ready data, I would always recommend using the APIs directly and not to use EO Browser for this.

Hi William,

Thank you for your response, yes when I was downloading the images I downloaded ‘visualized, custom’.

I understand that downloading the raw bands b04 and b08 and then calculating it in QGIS gives a more accurate measure for NDVI, with that being said, is the margin of error big when I download analysis ready data? Based on your expertise is the method I chose still reasonable enough to collect and later include in my research? I will mention using API’s directly could offer a more accurate measure in my limitation section regardless I do however want to be assured that downloading analysis ready data is still reasonable enough for academic research

Hi,

If you follow the method I showed, it is simple you will be downloading the raw NDVI values. I do not know enough about your research to be able to give you an opinion on that and it is not my place to. I suggested using APIs as this should help reduce any user error and is more repeatable but it isn’t compulsory.

Hi William,

Thank you for your input, I will be calculating NDVI through downloading RAW 04 RAW 08 bands and then do it in QGIS, thank you for your guidance.

I do want to ask generally for NDVI values, if the area I am calculating
e.g. city in california and a city in texas, would I need to do anything moving forward after obtaining the mean NDVI values on zonal statistics?

E.g. if the city in texas is larger than the city of california… would that mean the values need to be in proportion to the total area? I am assuming that the bigger the area the higher potentially the NDVI value can be.

Thanks!