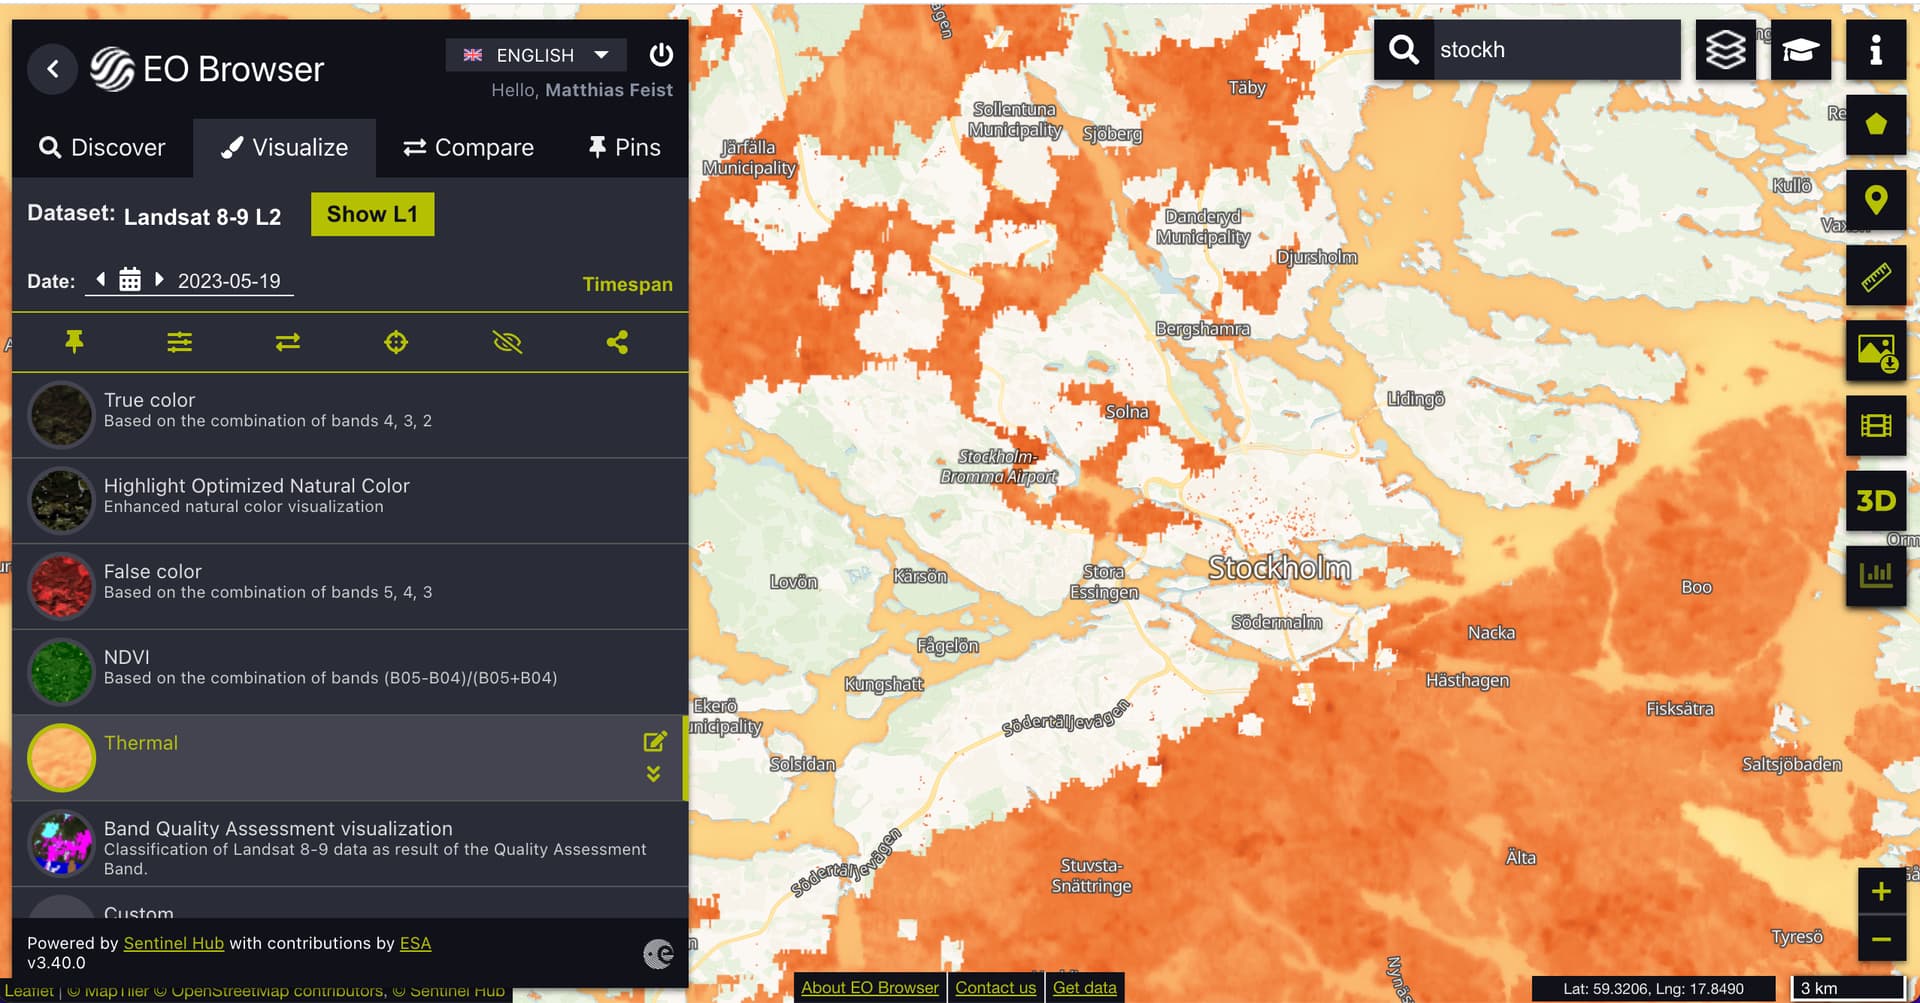
I’m currently playing around with the Thermal bands of Landsat (because I want to use it to analyse the Urban Heat Island Effect) and I found that for Stockholm, Sweden the L1 and L2 products behave quite differently. In the L2 product there are large holes in the data but not in L1 (couldn’t attach the screenshot to L1 because the forum only allows a new user to attach one image):
I don’t really understand what’s going on here since I just get started with Sentinel Hub and remote sensing. I hope that someone could help me out why this happens
For the computation of Collection 2 Level-2 products, other sources of data are used (including ASTER GED). These have missing data for some areas of the globe that propagate to the Landsat products.
amazing thanks a lot.
do you happen to know if the L1 product can still be used to estimate surface temperatures? I see a lot of algorithms around the internet that do it…