Hello Roman,
Landsat 8 Thermal is indeed based on B10 band. It’s not DN, but it’s already transformed to temperature in Kelvins based on the formula you provided on your link. If you use product THERMAL.INDEX you can get temperature directly into TIF file.
Great to know, thanks for answer!
However, I strugle to download Index values. I use configurator and when I use “INDEX” script, it is empty. Grayscale visualisation works normally. Do you have idea where the problem is?
Thanks!
I am using the sentinel-hub python api. with the polygon that is a the end of this text and the landsat thermal index default configuration and querying for this date 2015-02-01. the request is a WcsRequest with alpha layer and clipping to polygon… When a one date request is performed and there are overlapping images the WcsRequest returns only one instead of two, the returned image has all its thermal pixels set to 147. If one performs a search for a range including the date of interest (±1 day) the WcsRequest returns two images one with the faulty pixels and another with correct values. Same happens if a quality layer “return [decodeLs8Qa(BQA).cloudConfidence*0.33];” if queried.
I am guessing that the faulty images come for the tile where the polygon is at the limit of the tile where some landsat bands do not overlap perfectly
Is it there any possible solution?
The “THERMAL” layer / coverage is the default configuration for Landsat-8 thermal index. In this case as the request is different form the one I do at the python api, all values are 65535 instead of 147
Thank you. Looking briefly it seems there might be a bug on our side. We will check and come back.
Just a few additional comments (not impacting this issue, but in general):
TIME parameter should be “FROM/TO”, e.g. in this area there is no image on 2019-03-21, there is one on 2019-03-16, which is used as you only set “TO” part of the time range
Thermal band has resolution of 100m so it does not make much sense to use 10m resolution.
Thanks for the reply, I just saw that the date was not the one I meant (2015-02-01), but nice you could work it out anyway. Thanks for the 10m advice, the url was from another request and I just modified some important parameters.
Not for the moment as the bug needs to be analyzed. It (probably) is a bug and bugs usually have high priority in our workflow. However, it seems to be a very specific bug, affecting extremely small part of our users…
I will inform you, once we have more information.
You can avoid this issue by using 32-bit format ( FORMAT=image/tiff;depth=32f) for now.
We will update this thread once it is fixed for others as well.
Hello @gmilcinski, that request solves the problem with the wcs request in the browser, but it does not in the sentinelhub-py wcs request.
Is it any workaround for that?
The request I do using sentinelhub-py has this parameters, if you check the values of the first image returned on the list (corresponding to day 2015-01-16) you will see that all returned values within the polygon are 147.51712.
I see that this discussion is quite old but I did not find another one related to my question…
Actually I would like to write a custom script which used B10 and B11 from Landsat8 images but my script dos not return what it is supposed to do.
Ideally I would need a 8-bits value (or a 16-bits one) but it seems that it is not the case for B10 and B11 as it is for the other 9 bands. Could you confirm it please ? And let me know what is the value contained in B10 and B11 or how to convert it ?
Hopefully I can try and help you but I’m not exactly sure what you want to extract? Are you willing to share the custom script or explain in a little more detail what you wish to do in the script?
In the meantime, we recently added some examples for Landsat 8 in the documentation that can be found here:
You can parse these examples into the Request Builder site and then adjust the custom script in there to your requirements.
Also, a new feature if you toggle on the Data Product option in the custom script box you can find some other examples of thermal visualizations that maybe useful to you
Actually I see here (https://docs.sentinel-hub.com/api/latest/data/landsat-8/) that values for B10 and B11 are in Kelvin. Can you confirm it ?
If it’s true, can you tell me how to convert B10 and B11 values into 16bits reflectance values please? Indeed, since my script is the result of a machine learning model that has been trained on 16-bits reflectance values, for all Landsat8 bands, I need to apply it on this type of value to get the good prediction.
Yes I can confirm that the B10 and B11 values are in Kelvin.
Unfortunately, I don’t think it is possible within the platform to use reflectance values as we only provide the Kelvin value. To do this would require metadata coefficients that aren’t stored by us. I will try and confirm this with another member of the team but if I understand what you’re trying to do, I don’t think it is possible at the current time.
When I compute this myself on the image that EO Browser references (e.g., s3://usgs-landsat/collection02/level-2/standard/oli-tirs/2023/035/033/LC09_L2SP_035033_20230608_20230610_02_T1/
LC09_L2SP_035033_20230608_20230610_02_T1_ST_B10.TIF) my results are consistently 0.17 degrees C lower than the values extracted with the “Statistical Info” tool in EO Browser.
Are you using a different equation to convert from DN to temperature in degrees C?
Thank you!
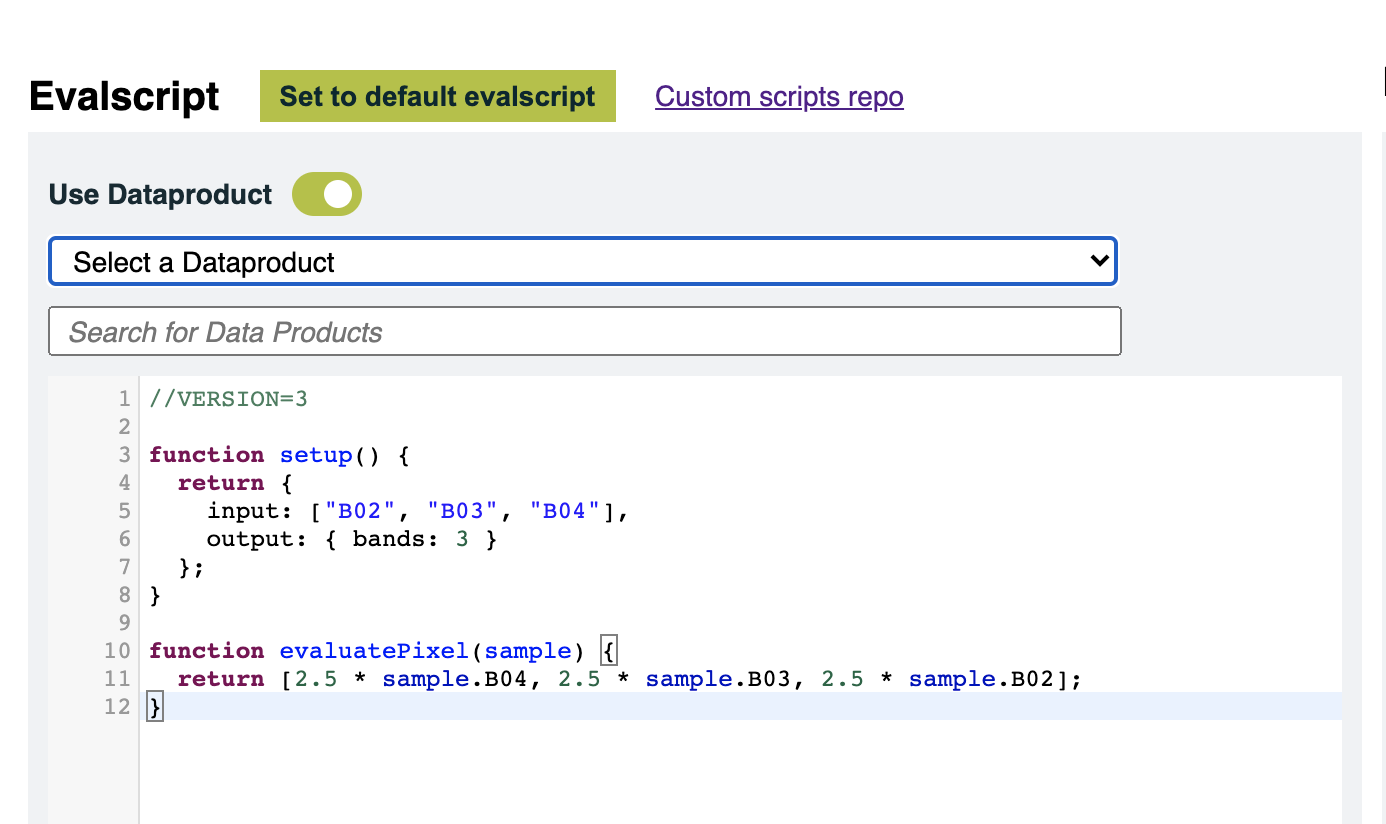
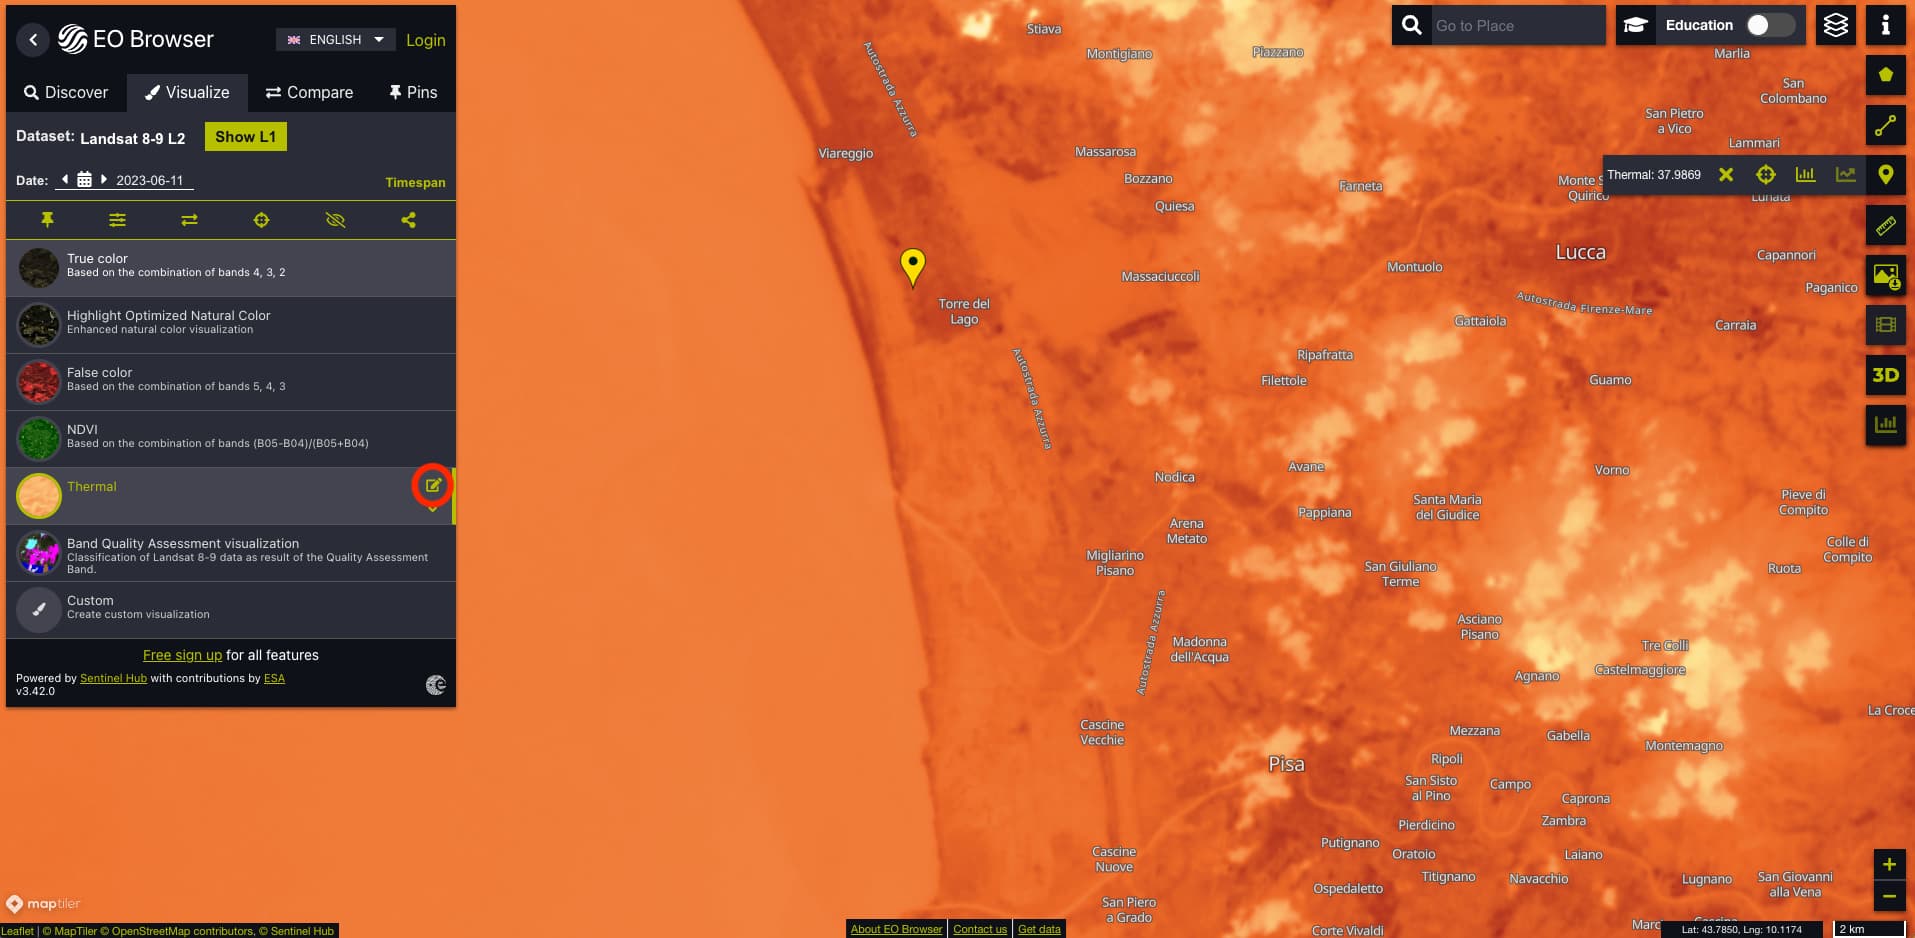
If you click on the small edit button of the layer in the EO Browser, you can see the Evalscript and thus the formula that is used for the Statistical tool (see the red circle in the figure below).
The conversion here is: B10 - 273, which explains the differences that you get with the formula you apply (the difference should be 0.15 not 0.17). If you want to apply your formula, you can edit the Evalscript (line 35) and hit the Refresh button.