Many Missing NDVI Statistics from Statistical API

Hello Community,

I am using Statistical API to get Mean NDVI of 16D aggregates over a period from 2018-01-01 to 2024-01-01, however I have 17 rows of missing data. I thought it might be due to too much snow, or clouds during certain months, but there is missing ndvi statistics for random months accross the years over a relatively large period of aggregation.
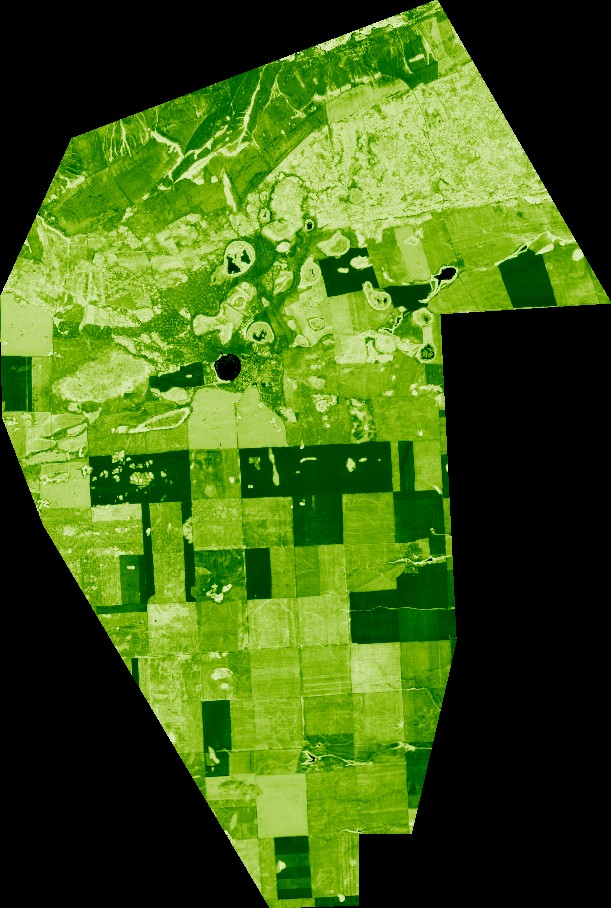
My geometry is:

geometry = Geometry(geometry={“type”:“Polygon”,“coordinates”:[[ [63.382482692313204, 54.17818392226579], [63.338577578717974, 54.12093395661344],
[63.34023437545781, 54.077701508906074], [63.36508632654895, 54.039288878379864],
[63.50342885429086, 53.90139241854814], [63.55727474832349, 53.90236855321484],
[63.55727474832349, 53.92822781232164], [63.58958228474151, 53.92822781232164],
[63.61691943094314, 53.997432204973705], [63.606978650505795, 54.115107490724455],
[63.711356845089824, 54.11899189232207], [63.60523321157419, 54.228007835352656],
[63.382482692313204, 54.17818392226579]]]}, crs=CRS.WGS84)

resx: 0.0004
resy: 0.0004

in my code I mask data with snow, water SCL, and CLM to mask cloud pixels

Please help fix the missing data issue, would be greatly appreciated.

Hi Timur,

Please can you provide more information. I need your full request to be able to replicate your issue.

I solved the issue but using a different scipt :

geometry = Geometry(geometry={"type":"Polygon","coordinates":[[ [63.382482692313204, 54.17818392226579], [63.338577578717974, 54.12093395661344],
    [63.34023437545781, 54.077701508906074], [63.36508632654895, 54.039288878379864],
    [63.50342885429086, 53.90139241854814], [63.55727474832349, 53.90236855321484],
    [63.55727474832349, 53.92822781232164], [63.58958228474151, 53.92822781232164],
    [63.61691943094314, 53.997432204973705], [63.606978650505795, 54.115107490724455],
    [63.711356845089824, 54.11899189232207], [63.60523321157419, 54.228007835352656],
    [63.382482692313204, 54.17818392226579]]]}, crs=CRS.WGS84)
 evalscript = """
 //VERSION=3
 function cloud_free(sample) {
   var scl = sample.SCL;
   var clm = sample.CLM;
 
   if (clm === 1 || clm === 255) {
     return false;
   } else if (scl === 1 || scl === 3 || scl === 8 || scl === 9 || scl === 10 ) {
     return false;
   } else {
     return true;
   }
 }
 
 function setup() {
   return {
     input: [{
       bands: [
         "B04",
         "B08",
         "SCL",
         "CLM",
         "dataMask"
       ]
     }],
     mosaicking: "ORBIT",
     output: [
       {
         id: "data",
         bands: ["daily_max_ndvi"]

      },
      {
        id: "dataMask",
        bands: 1
      }
    ]
  };
}

 function evaluatePixel(samples, scenes) {
  var ndvi = 0;
  var hasData = 0;

  for (var i = 0; i < samples.length; i++) {
    var sample = samples[i];

    if (cloud_free(sample) && sample.dataMask == 1 && sample.B04 + sample.B08 != 0) {
      hasData = 1;
      ndvi = (sample.B08 - sample.B04) / (sample.B08 + sample.B04);
      
    }
  }

  return {
    data: [ndvi],
    dataMask: [hasData]
  };
}
"""
request = SentinelHubStatistical(
        aggregation=SentinelHubStatistical.aggregation(
            evalscript=evalscript,
            time_interval=(2019-01-01T00:00:00Z', 2022-01-01T00:00:00Z'),
            aggregation_interval='P14D',
            resolution=[0.0004, 0.0004],        
        ),
        input_data=[
            SentinelHubStatistical.input_data(
                DataCollection.SENTINEL2_L2A,                        
            ),
        ],
        geometry=geometry,
        config=config
    )

This seems to have solved the problem of missing values and NDVI mean values being very high during January-March. I include snowy pixels because I am analyzing a region with heavy snow in the winter. However, I am running into issue where I have a very high No Data count i.e. ‘sampleCount’: 761444, ‘noDataCount’: 618623

I am not sure how to solve this would appreciate any help with this please!

PS: not sure how to turn text into code chunks

Hi Timur,

Okay that gives me a bit more information. Have you examined the images on the dates with the missing data values? As you mentioned the snow cover, this could also be misclassified as cloud in the scene classification layer. Perhaps, pixels that are snowy have been misclassified as cloud (turning them into No data in your evalscript) in the dates which a lot of missing data.

1 Like

Appreciate the help William!

Unfortunately, All the image aggregates throughout a 14 day interval have at least 30% missing data even though the area is relativly small 600km^2. I provided a table for more context. In the request builder when I select

|Date | Mean | DataCount | NoDataCount|

|2019-01-15 | 0.016475 | 761444 | 324374|
|2019-01-29 | 0.005116 | 761444 | 486445|
|2019-02-12 | 0.023841 | 761444 | 324917|
|2019-02-26 | 0.012650 | 761444 | 501539|
|2019-03-12 | 0.020261 | 761444 | 324227|
|2019-03-26 | -0.020379 | 761444 | 324273|
|2019-04-09 | 0.096634 | 761444 | 330970|
|2019-04-23 | 0.186941 | 761444 | 325251|
|2019-05-07 | 0.205631 | 761444 | 325401|
|2019-05-21 | 0.201300 | 761444 | 345856|
|2019-06-04 | 0.300733 | 761444 | 329889|
|2019-06-18 | 0.360757 | 761444 | 330752|
|2019-07-02 | 0.450101 | 761444 | 378668|
|2019-07-16 | 0.573141 | 761444 | 524382|
|2019-07-30 | 0.567884 | 761444 | 324206|
|2019-08-13 | 0.521482 | 761444 | 354978|
|2019-08-27 | 0.383299 | 761444 | 330823|
|2019-09-10 | 0.339941 | 761444 | 465681|
|2019-09-24 | 0.358677 | 761444 | 324209|
|2019-10-08 | 0.313830 | 761444 | 445266|
|2019-10-22 | 0.270382 | 761444 | 362939|
|2019-11-05 | 0.254439 | 761444 | 373288|
|2019-11-19 | 0.044294 | 761444 | 716708|
|2019-12-03 | 0.069730 | 761444 | 560349|
|2019-12-17 | 0.030543 | 761444 | 337218|
|2019-12-31 | -0.018651 | 761444 | 618623|

I took an example from 2019-07-02 to 2019-07-16 which shows 524382 data missing and verified NDVI(B04, B08) image with process api and I get a clear NDVI image within my polygon.

I’m trying to understand what I am doing wrong here, would appreciate more of your advice!

The image makes it clear to me what the issue is. As you can see in the docs and this example, your Statistical API request includes the pixels outside your AOI.

if you change the dataMask output to samples.datamask the number of no data pixels should become a constant number of pixels. Right now, it will include cloudy pixels and the pixels outside the AOI too.

I just rewatched the Statistical API webinar, I’m a bit confused as it is said in the webinar that noDataCount actually shows the number of pixels that were excluded from the calculation. Does that mean that actually my code works as intended, since the line:

if (cloud_free(sample) && sample.dataMask == 1 && sample.B04 + sample.B08 != 0) {
hasData = 1;
}
makes hasData = 1 only if pixels are not cloudy, there is data and the data is valid, otherwise hasData = 0 and hasData is what is outputted in the dataMask?

It’s the same logic as another example script:

Yes, your logic looks correct I think.

Just to confirm in the docs it says:

Note that the Statistical API does not automatically exclude the no data pixels from calculating the statistics. We recommend that you always exclude those unless there is a good reason not to. This is especially important when you are requesting statistics for a polygon, as it will ensure that pixels outside of the polygon (and inside of the bounding box) are excluded. To exclude no data pixels you need to pass input dataMask band to the dataMask output, e.g.: