We are connecting to NDVI Sentinel 2 images using WCS. In some areas the NDVI values are correct but in one specific area the NDVI values are incorrect. We know they are incorrect because when we compared with the same image opened in EOBrowser the values are different. Also because the values are very similar during one year and it’s an agricultural area with annual crops. What can happen in this area?
One particularity of this area is that two satellite images are superimposed, could it be the cause of our results? How can we solve it?
Unfortunately, your info is still to “wide” for us to identify the issue.
Few questions:
is the NDVI evalscript you are using in your WCS the same as the one in EO-Browser?
EO-Browser is showing a specific date; are you sure you have requested (that same) specific date, and not larger time-window, where mosaicking order specified in your WCS layer configuration would define which date from that time-window is returned?
are you sure that maxcc parameter in EO-Browser is the same as the one in your WCS request?
Hopefully this points you to some possible explanations.
Adding more information from my partner who started the thread:
The path we use to connect is: https://services.sentinel-hub.com/ogc/wcs/…?&TIME=20200706&.
We use the product “NDVI-GRAY (Normalized Difference Vegetation Index - Grayscale)” for the day in question.
We understand that the browser displays the same as the EO. Isn’t it?
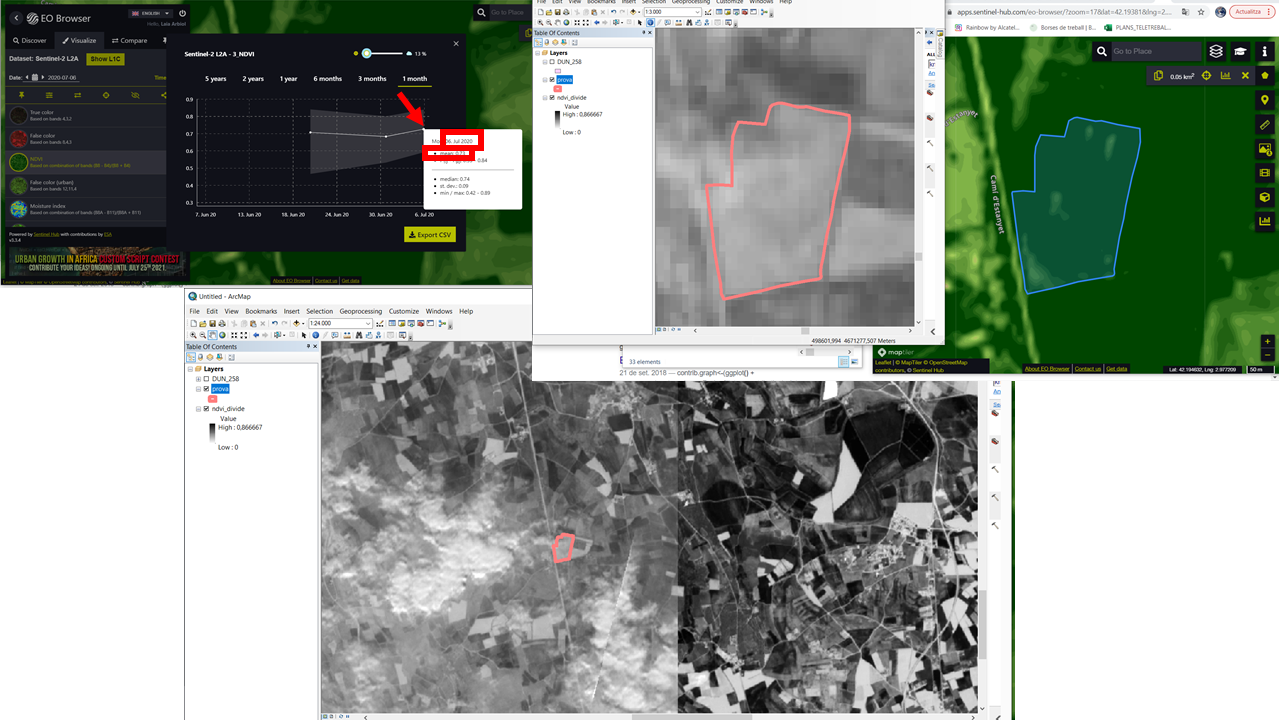
I show you a plot that is BARLEY. It maintains a curve like a Gaussian bell being more intense in the months of June and July.
If I look at information EO gives values of 0.73 while the connection shows average values of 0.312271687.
Also I attach global image to understand if the values are different because it is an area where two satellite images are overlap.
I don’t think so. The plot in EO-browser is done with raw index values, not from a product that is used for visualisation. The NDVI-GRAY in your case is NDVI mapped to grayscale values, resulting in all positive values, while raw index can be negative as well. This probably also explains different values in 2).
Where the two satellite tiles overlap, the mosaicking control how they will be joined together, which might really affect your results. As the matter of fact, if you are after temporal evolutions like shown in EO-Browser (your image in upper left corner), then I suggest you have a look at the StatAPI, and example in sh-py
Thanks for that!
In this case, NDVI GRAY product has been used previously with other agricultural plots and the results are the same like the EO. That’s why we thought the problem was overlapping. The problem is that we have 20,000 agricultural plots to analyze for a year.
Thanks, we will see StatAPI (and also learn python).