Hello, I’m developing an NDVI view based on sentinel data.
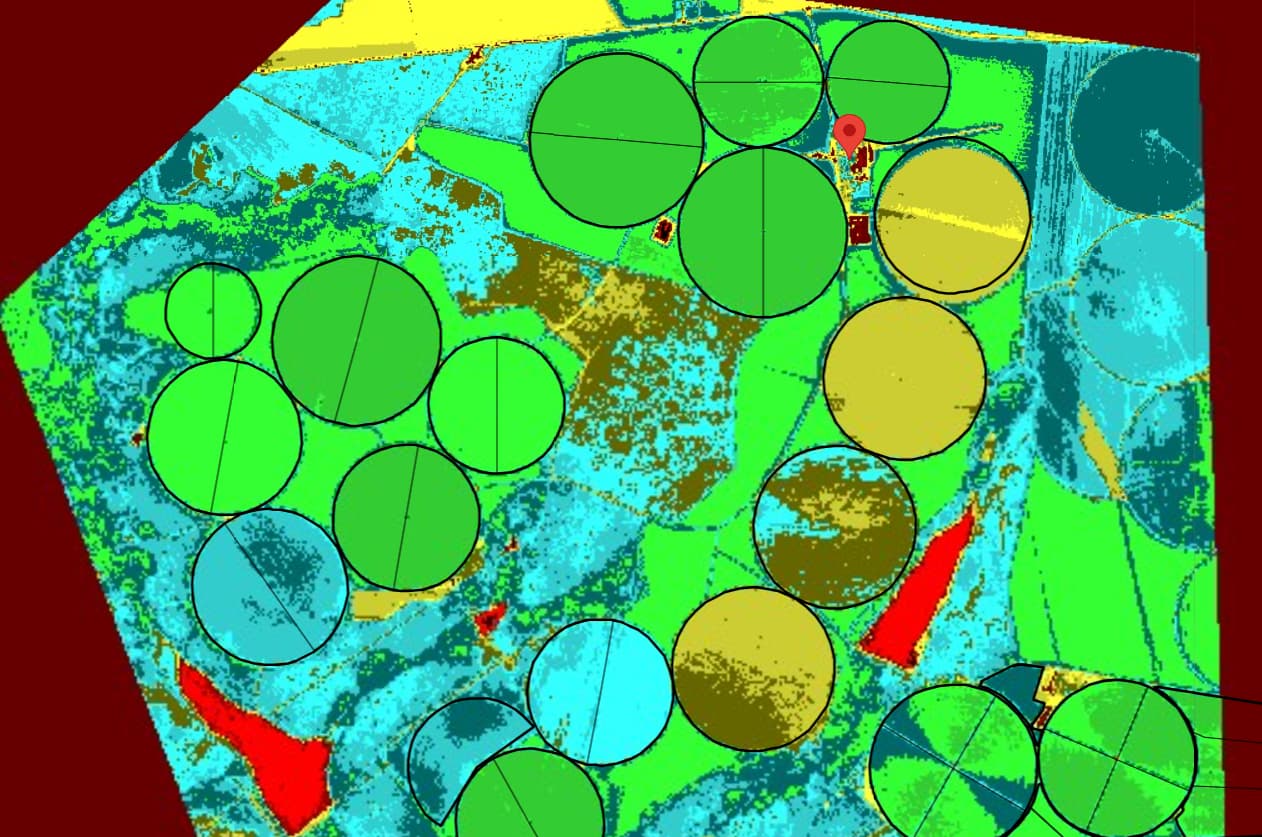
I pulled the data according to the NDVI provided by the platform and the image is the first one, but I wanted something similar to this other solution below.
I know she also uses Sentinel, but I believe I do another calculation between the bands, could someone help me calculate to get something similar?
Please can you be more specific in what you are asking. I am not sure what either visualisation is meant to be showing or where your source for the second visualisation is.
If you are looking for evalscripts to visualise NDVI or other vegetation indices, then I encourage you to read through the Custom Scripts Repository.
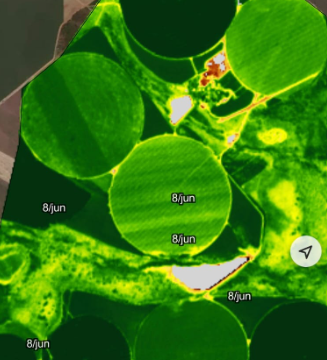
The second image concerns NDVI from a system called OneSoil, which uses Sentinel imagery.
I wanted to generate something like this, since the vegetative index view is clearer.
In the second image, from OneSoil, you can better see the problems that can occur in the field, such as low vegetative development due to irrigation failures, for example.
I don’t know if you can understand what I’m saying.
I can try to express myself better.
If you want to create a custom visualisation then I would recommend reading through this documentation page. From this, you should be able to create your own colour ramp; continuous or discrete. You should also check out this FAQ if you then want to create a legend for this too.
You would need to contact OneSoil if you want to find out more about their products and visualisations.
In the examples you provided the top image appears to have NDVI values classified and colours assigned to the classes. In the lower image you provided NDVI values appear to be assigned a continuous gradation of colours and so I would assume it uses a colour ramp.
Assuming that I have interpreted your question correctly, you want to apply a colour ramp to NDVI values in an EvalScript V3 script. To do this have a look at the documentation for Utility Functions. I would recommend reading about ColorRampVisualizer.
The example I’m including may be useful. You will have to adjust the colour ramp to suit what you are trying to do.