I am calculating NDVI from S2-L2A images downloaded from Copernicus Open Data using sentinelsat in QGIS(raster calculator) & following this tutorial (I saved xarray to tif for comparison). I observe that the values obtained are different from both the methods, as original band values also differ by around 1000, hence the mean also varies & there is significant difference among the two means obtained for my interest area. I used a recent image of year Nov’2022. The mean value obtained from sentinelsat images is low as compared to NDVI from the pystac method. (for same area of interest)
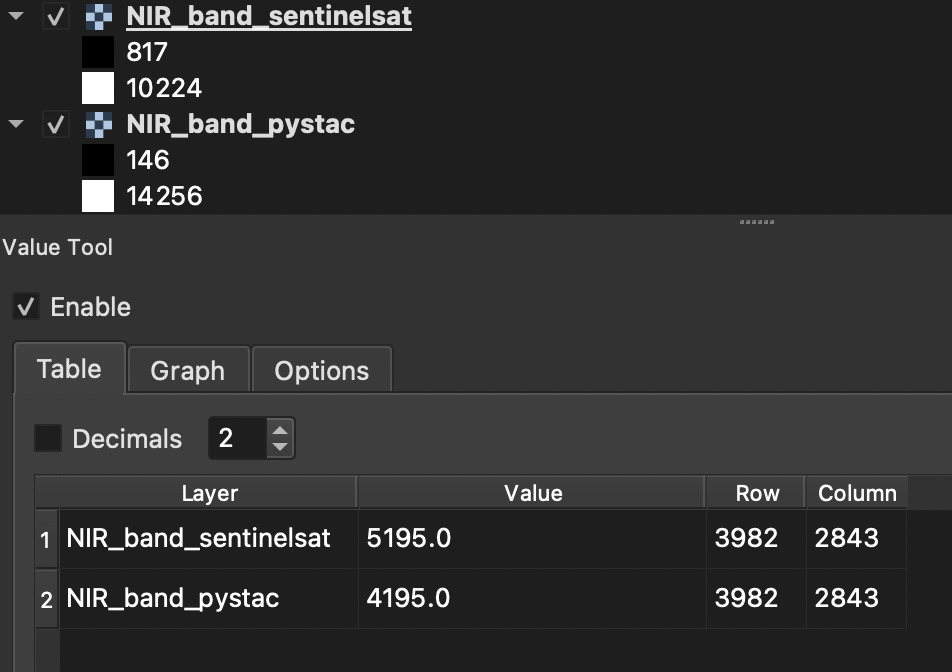
I am also confused about the values for individual bands I am getting, are these values DN or reflectance, as per the documentation and values I think both are reflectance multiplied by 1000. The image shows comparison for the values for NIR band (Band 8) for both sources, as we can see both max & min values are different for both sources and also the value at a point is different by 1000 (which is due to the harmonisation changes), which NDVI is correct & I should follow ?
Hi @ARay,
this is probably due to the “harmonizeValues” parameter, which is default in Sentinel Hub.
Try to set this to “false” and you should get same results.
However, if you are interested in long-term time-series, you will then have an inconsistency in values prior to January 24th and after. Inconsistencies, which are in the “raw data” and which we addressed with this parameter. Therefore, if you want consistent time-series, it is better to keep the harmonizeValues set to “true”.
Best,
Grega
1 Like