Hello everyone, I’m trying to dynamically get the maximum and minimum NDVI values for my Area of Interest (AOI), but the image visualization only returns one color. I want to assign colors dynamically based on the retrieved minimum and maximum values from the function. Here’s my script:
//VERSION=3

function setup() {
  return {
    input: ["B04", "B08", "dataMask"],
    output: [
      { id: "default", bands: 4 },
      { id: "index", bands: 1, sampleType: "FLOAT32" },
      { id: "eobrowserStats", bands: 2, sampleType: "FLOAT32" },
      { id: "dataMask", bands: 1 },
    ],
  };
}

function evaluatePixel(samples) {
  const red = samples.B04;
  const nir = samples.B08;
  const ndvi = (nir - red) / (nir + red);
  const aoiMask = samples.dataMask;

  // Calculate minimum and maximum NDVI values within the AOI
  let minValue = Number.MAX_VALUE;
  let maxValue = Number.MIN_VALUE;
  let countValidPixels = 0; // Count the number of valid pixels within the AOI

  for (let i = 0; i < aoiMask.length; i++) {
    if (aoiMask[i] === 1) {
      const pixelNDVI = ndvi[i];
      if (!isNaN(pixelNDVI)) {
        countValidPixels++;
        minValue = Math.min(minValue, pixelNDVI);
        maxValue = Math.max(maxValue, pixelNDVI);
      }
    }
  }

  // Define color values for minimum (red), maximum (green), and other values (linear interpolation)
  const minColor = [0.67578125, 0.0, 0.15625, samples.dataMask]; // Red
  const maxColor = [0.0, 0.4921875, 0.27734375, samples.dataMask]; // Green

  // Linear interpolation function to calculate colors between minColor and maxColor
  function interpolateColor(value) {
    const t = (value - minValue) / (maxValue - minValue);
    const r = minColor[0] + t * (maxColor[0] - minColor[0]);
    const g = minColor[1] + t * (maxColor[1] - minColor[1]);
    const b = minColor[2] + t * (maxColor[2] - minColor[2]);
    return [r, g, b, samples.dataMask];
  }

  // Assign colors based on the NDVI value
  let imgVals;
  if (countValidPixels > 1) {
    if (!isNaN(ndvi)) {
      if (ndvi >= maxValue) {
        imgVals = maxColor;
      } else if (ndvi <= minValue) {
        imgVals = minColor;
      } else {
        imgVals = interpolateColor(ndvi);
      }
    } else {
      imgVals = [0, 0, 0, samples.dataMask]; // Set to black for NaN values
    }
  } else {
    imgVals = [0, 0, 0, samples.dataMask]; // Set to black when there's only one unique NDVI value in the AOI
  }

  return {
    default: imgVals,
    index: [ndvi],
    eobrowserStats: [ndvi, isCloud(samples) ? 1 : 0],
    dataMask: [samples.dataMask],
  };
}

function isCloud(samples) {
  const red = samples.B04;
  const nir = samples.B08;
  const ndvi = (nir - red) / (nir + red);
  return ndvi < 0; // Assuming negative NDVI values correspond to clouds
}
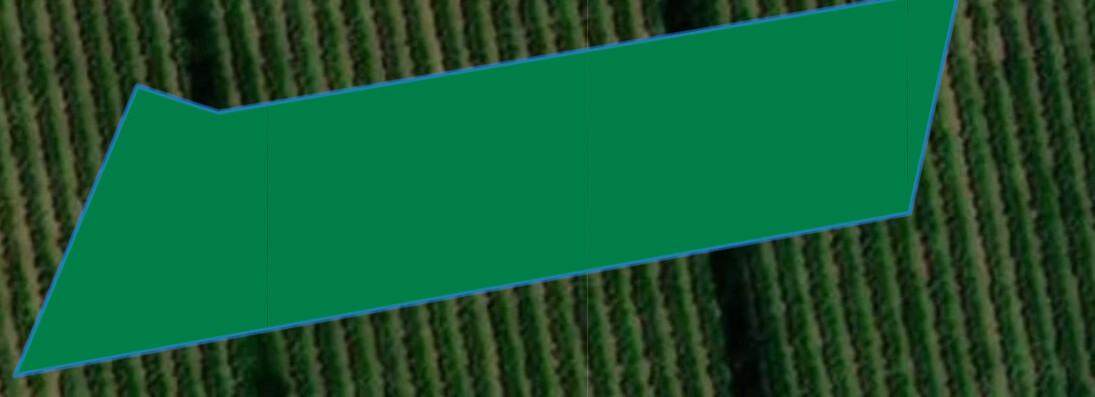
result: