Normalization of Sentinel data for ML downstream

Hi,
I am working on a sentinel dataset in the application to use the images for classification.

The dataset I have is in numpy array (13,40,40) containing information on the 12 bands (B1-B12) as described here.

Some of the bands are in RGB (B2, B3, B4) which can be normalized by the typically used 255.0 (uint8).
My question is how to select the value for normalizing the other bands (!B2, B3, B4) in the given list of B1-B12.

Thanks so much for helping me.

Hi @skr3178!

Let me first check if I understand correctly. By RGB band normalization, are you referring to the following:

  • dividing the digital numbers (UINT16) by 10000
  • clipping of the values to the interval [0.0, 0.3]
  • rescaling [0.0, 0.3] to [0, 255] (UINT8)

?

If yes, then it should be pointed out that this process isn’t really specific to the RGB bands, in principle it can be repeated for other bands as well. I don’t have the general distributions of values for each band at hand, but in principle this is just a cutoff to focus on the range where the values are more frequent.

Perhaps you could draw the histograms for your data yourself and base the cutoff on that?

Did you perhaps already try this and what you get is nonsense? What exactly did you try?

Cheers,
Matic

Hi @matic.lubej Matic,

Thanks for replying.
I want to normalize the other bands which are not red, green and blue.

For RGB, I can divide the values by 255. But the other bands go up to 10,000. What should I used to normalize?
How can I do that?

Thanks,
Sangram

Hi @skr3178!

Probably there is some confusion. All bands in their Digital Number representation can go up to 10,000. These are usually divided by 10,000 to roughly fit in the [0.0, 1.0] interval, and then the range can even be clipped (i.e. to [0.0, 0.3]). The image services usually use the 8bit representation of the image, this is when the available values get stretched to [0, 255].

What I suspect is happening here is that you downloaded all bands, but the RGB was somehow preprocessed differently. If possible, could you provide:

  • the numpy dataset you mention
  • the evalscript/code how you obtained the data
  • the piece of code you use to plot the data

The above will help to pinpoint the issue.

Cheers,
Matic

1 Like

Hi @matic.lubej
Thank you for replying.

The other bands have different values as the highest in their category.
Some at 10500, others 11000, etc for example.

Therefore I am not clear on what uniform value to use for the normalization.

I have attached the numpy files here

Please let me know if the link does not work.
Thank you for your help.
Sangram

Hi @skr3178!

The other bands have different values as the highest in their category.
Some at 10500, others 11000, etc for example.

Yes, you are correct, the band values can end up larger than 10000, because a pixel can be affected by the reflectance of neighboring pixels, so this is not unusual and can happen also to the RGB bands.

In reality, these values are ignored via cutoff, which I would suggest you do as well. For example, when I usually plot images with matplotlib in python, I do the following if I work with DN values:

import numpy as np
import matplotlib.pyplot as plt

# data is of shape (13, 40, 40)

# reshape data
ndata = np.moveaxis(data, 0, -1)  # ndata is of shape (40, 40, 13)

# select RGB (or any other combination)
rgb = ndata[..., [4,3,2]]

# plot image
plt.imshow(rgb/10000*3.5)

image

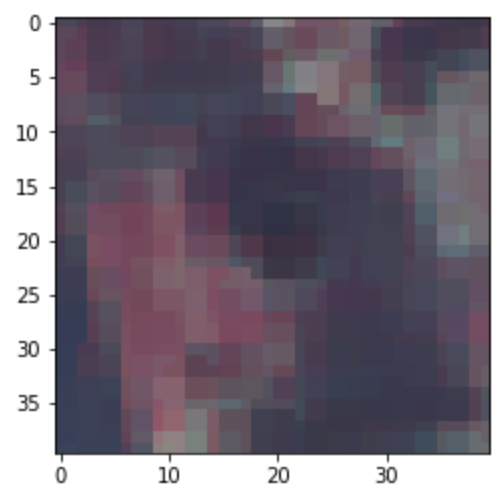
matplotlib draws float values from [0.0, 1.0] and maps them to [0, 255] when drawing an image (out of range values are ignored), so this is why I divided with 10000 to get the reflectances, and then multiplied with 3.5 to increase the range so that the image is brighter (generally the values are at 0.4 and below).

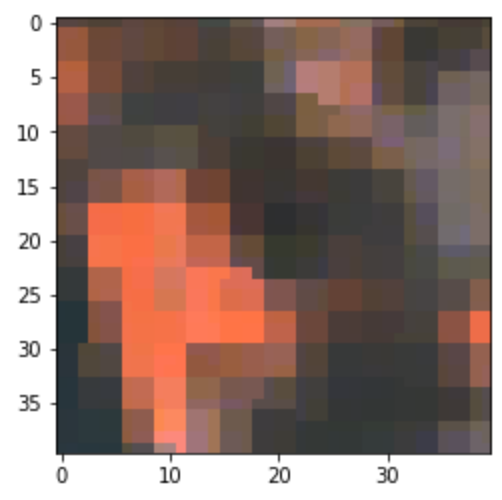
The same can be achieved with the following cutoff procedure and plotting 8bit integer data directly:

ndata_cutoff = np.clip(ndata/10000, 0, 0.3)  # divide with 10000 and cut of to range [0.0, 0.3]
ndata_normalized = ndata_cutoff/0.3  # stretch to [0.0, 1.0]
ndata_8bit = (ndata_normalized*255).astype(np.uint8)  # stretch to 255 and convert to uint8
false_color = ndata_8bit[..., [8,4,3]]  # select false color bands for plotting

plt.imshow(false_color)

image

I would say the normalization procedure shown is good for any kind of band, exceptions are weird locations, like bright deserts, clouds, etc.

Hope this helps! Let me know if there’s anything still unclear.

Cheers,
Matic

2 Likes