hello there,
im using the true color filter, and whenever i add a pin it removes the previous one and just updates its place, where i want to add a new pin and give it a new name, is there something to do about this?
thank you.
hello there,
im using the true color filter, and whenever i add a pin it removes the previous one and just updates its place, where i want to add a new pin and give it a new name, is there something to do about this?
thank you.
Dear @worldaction2009,
unfortunately I am not able to reproduce the problem you describe. Could you maybe share with us a link of the location where this is happening and describe what you mean by “using true color filter”. It might also help us to know if this is happening while being logged in or not. Thanks!
Until then you could try to rename your pin after creating it and see if it still gets overwritten when it has a different name.
Best,
Daniel
attached please find the illustration gif file, what i meant by true color is the option in the visualize tab
the issue is when i press in the right hand side on the pin icon and place one, I seem to only be able to have one pin placed at all times, because whenever i place a new pin, it just replaces the old one which forms an issue for me, if this issue has a solution please let me know,
all the best.
Hey, nice to see new users.
I think there is some confusion here. I think that what you think is one functionality is in fact two separate functionalities.
Pins in the Pins tab on the left are the items that contain information about:
They can be created from visualizations on Visualize tab or from Highlights in Discover tab. And can be exported to your computer or shared with others.
So, when some pin is selected, display should look the same as when the pin was created.
If you are logged in to EO Browser, the pins are saved to your account, so you can view them later or on other devices as well.
They act like browser’s bookmarks.
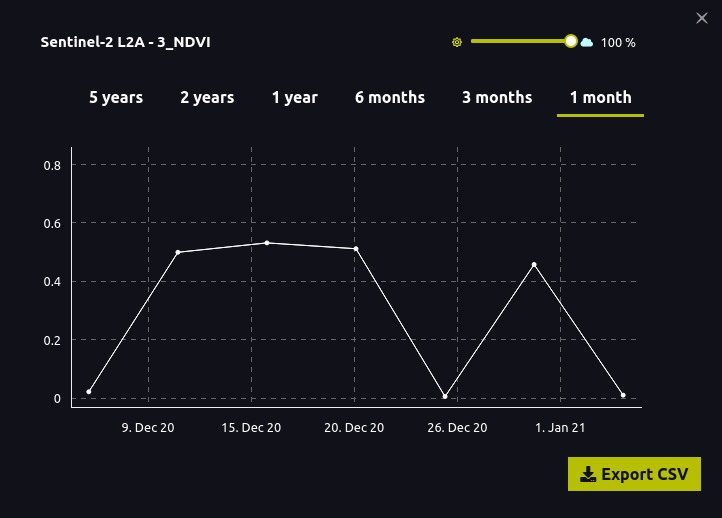
The pin-like icon on the right represents a Point of interest.
This tool enables users to view statistical info of that set point (location) in a form of a graph of values through time, using a selected layer in Visualize tab. (example below)
The statistical info is available only for some layers (NDVI and other indexes; and some other layers).
Export of statistical info is also possible.
At this moment, creating multiple points of interest or saving them is not possible.
Hope this clears things up.
Cheers!
thank you very much for your support, indeed i am a new user, and so far tbh I’m impressed with the whole setup, one thing wasn’t quite clear there, when i go to the visualize tab, then what is the next step to create a pin, my goal here is to save locations and give them distinguish names, i cant seem to find the add pin feature you mentioned in the visualize tab, could you elaborate a bit more please, thanks again.
Hey,
there are quite a lot of tools in the Visualize tab.
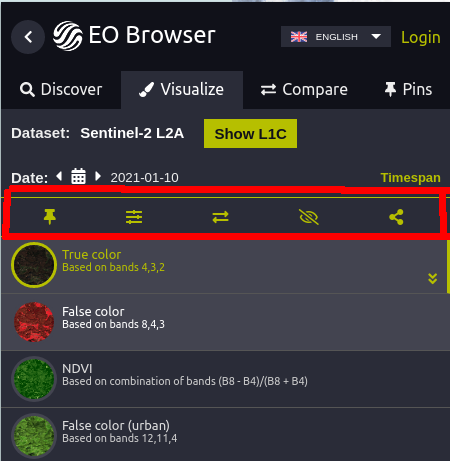
The button to create a pin is the first from the left in the ribbon right above the list of layers, in the Visualize tab.
Other buttons in that ribbon (In the red marked part in the image below) described below - from left to right:
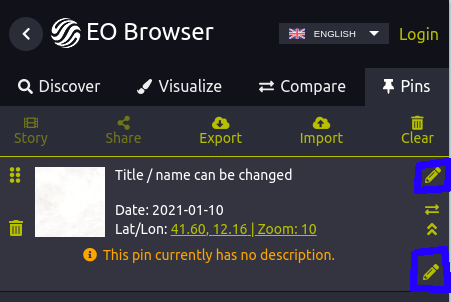
Pin’s title/name and description can be changed any time in the Pins tab (icons marked with blue).
There’s also a tutorial shown when you click on the i icon in the top right corner. It’s a bit long, but it goes through all the features of EO Browser, if you are interested in them.
Cheers!
well, that was quite helpful, exactly what i was looking for,
thank you very much everyone, have a nice day