Hi, I have just upgraded to the monthly exploration and also 100euros of Pleiades data.
How do I determine the area of coverage and the date of the images I would like to retrieve?
This amount corresponds to 11.77 sq. km of Pleiades data.
You can always get your remaining quota using the API or within the Request Builder
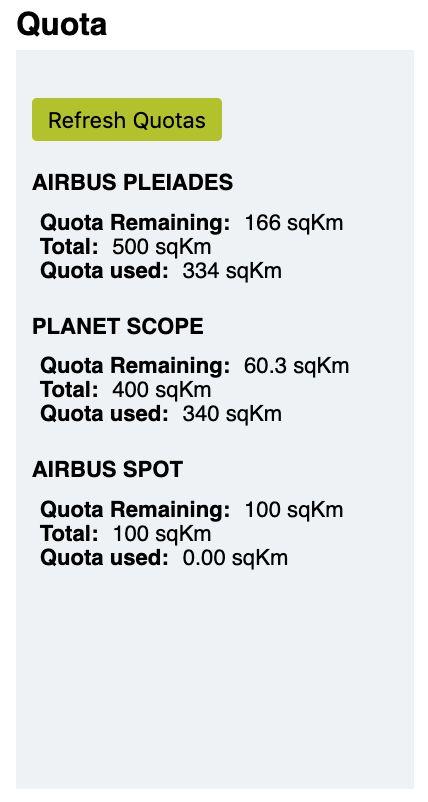
If you search for the data using Request Builder, you will also see, how much sq. km each of the orders will consume
Grega,
Is there user guide for the Request Builder as I am struggling to identify the location area. I placed a box on the map but it was wrong and could not delete.
Also could you maybe advice on the best format that could be used for seeing large herbivores on the imagery?
Check section 8 in this document:
You can always refresh the application and it will reset.
You should not need to worry about formats. Once you order the data, you can look into it in EO Browser directly, or in your GIS.
It is now telling me the bounding box is too large. Is there a way of inputting the AOI and then from this working out what it is going to cost to get that coverage?
Hm, can you perhaps describe more in details, what you would like to search for and we try to give you instructions fitting your needs directly?
11.7 sq. km is not a large area, so you will very soon be over the quota, thus not allowed to submit an order.
Grega, I can indeed. I have a map with the area in question. I have sent on email as it is too large for here.
The map you have sent covers an area about 10.000 sq. km, way more than you can consume with the current quota.
I picked one small part, where there are somehow dense number of sighthings, cca 5.5 sq. km size.
What you can do:
-
Go to Request Builder
-
Click “Upload KML/GeoJSON”
-
Upload this file:
area1.kml (363 Bytes) -
Set Time range: 2018-01-01 to 2020-11-11
-
Switch “Advance options” in “Search options” part and set Cloud coverage to 10% (to try to get as cloudless data as possible)
-
Click “Search for the data” in “Search Results” section
-
You will find that there is only one observation available in this period, fitting the cloud coverage criteria, taken on 2018-07-03
-
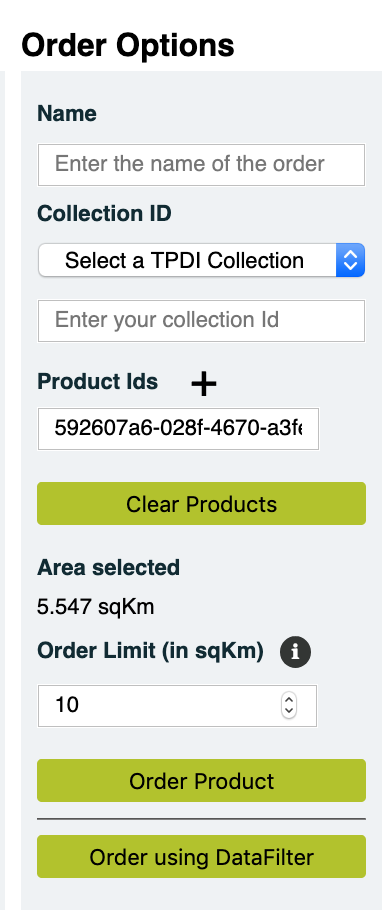
Expand the result and click “Add to orders”
-
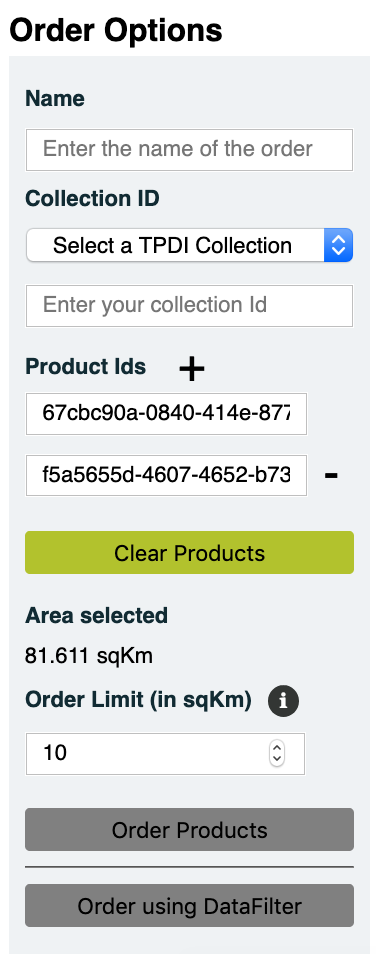
Check “Order options” part and click “Order Product”
-
Check “Orders” part and click “Get your orders”
-
Click “Confirm Order”

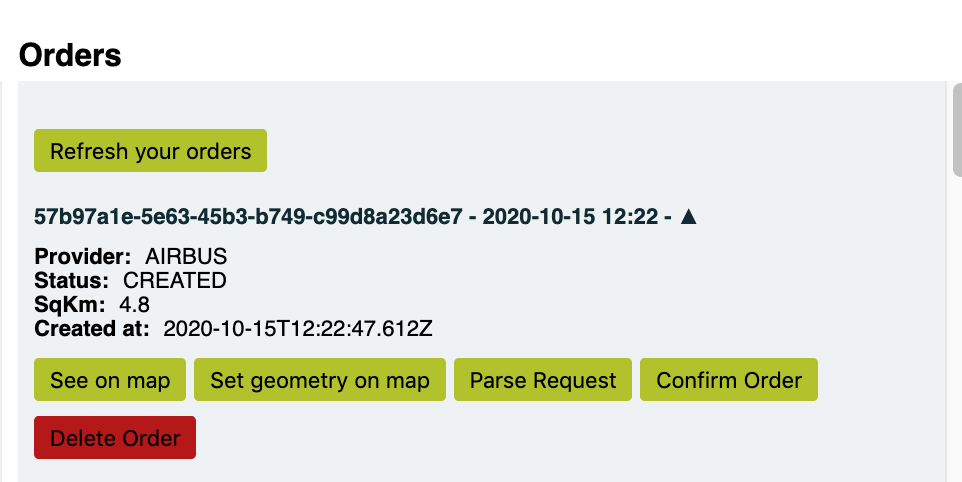
At this point you submitted an order and you have to wait for it to be delivered, from a couple of mintues to a couple of hours.
Once done, you just need to configure an instance to be able to visualise this. Let me know if you have an issue with that part and we will help you there as well. It’s only once that you have to go through this…
Grega,
Very helpful thank you. I have placed the order and await the delivery. I hope you don’t mind but I will take you up on your offer of showing us how to read the data.
In the meantime I do have a few more questions with regards to getting more data.
Would it be possible to do larger areas? I suppose it will just cost more?
Is there a possibility of being able to get data for specfic days, ie my initial request was for 26/27/28 of Aug 2019 or are we limited by a number of factors such as cloud cover and satellite passes?
Do you think this could be a good project for an experimental account as you mentioned previously. I did look at this but could not find where i need to submit the information?
Here you go. Data are ingested. I have configured your configuration as described here.
The only step remaining is to actually check the data:
-
Go to EO Browser
-
Login with your username and password.
-
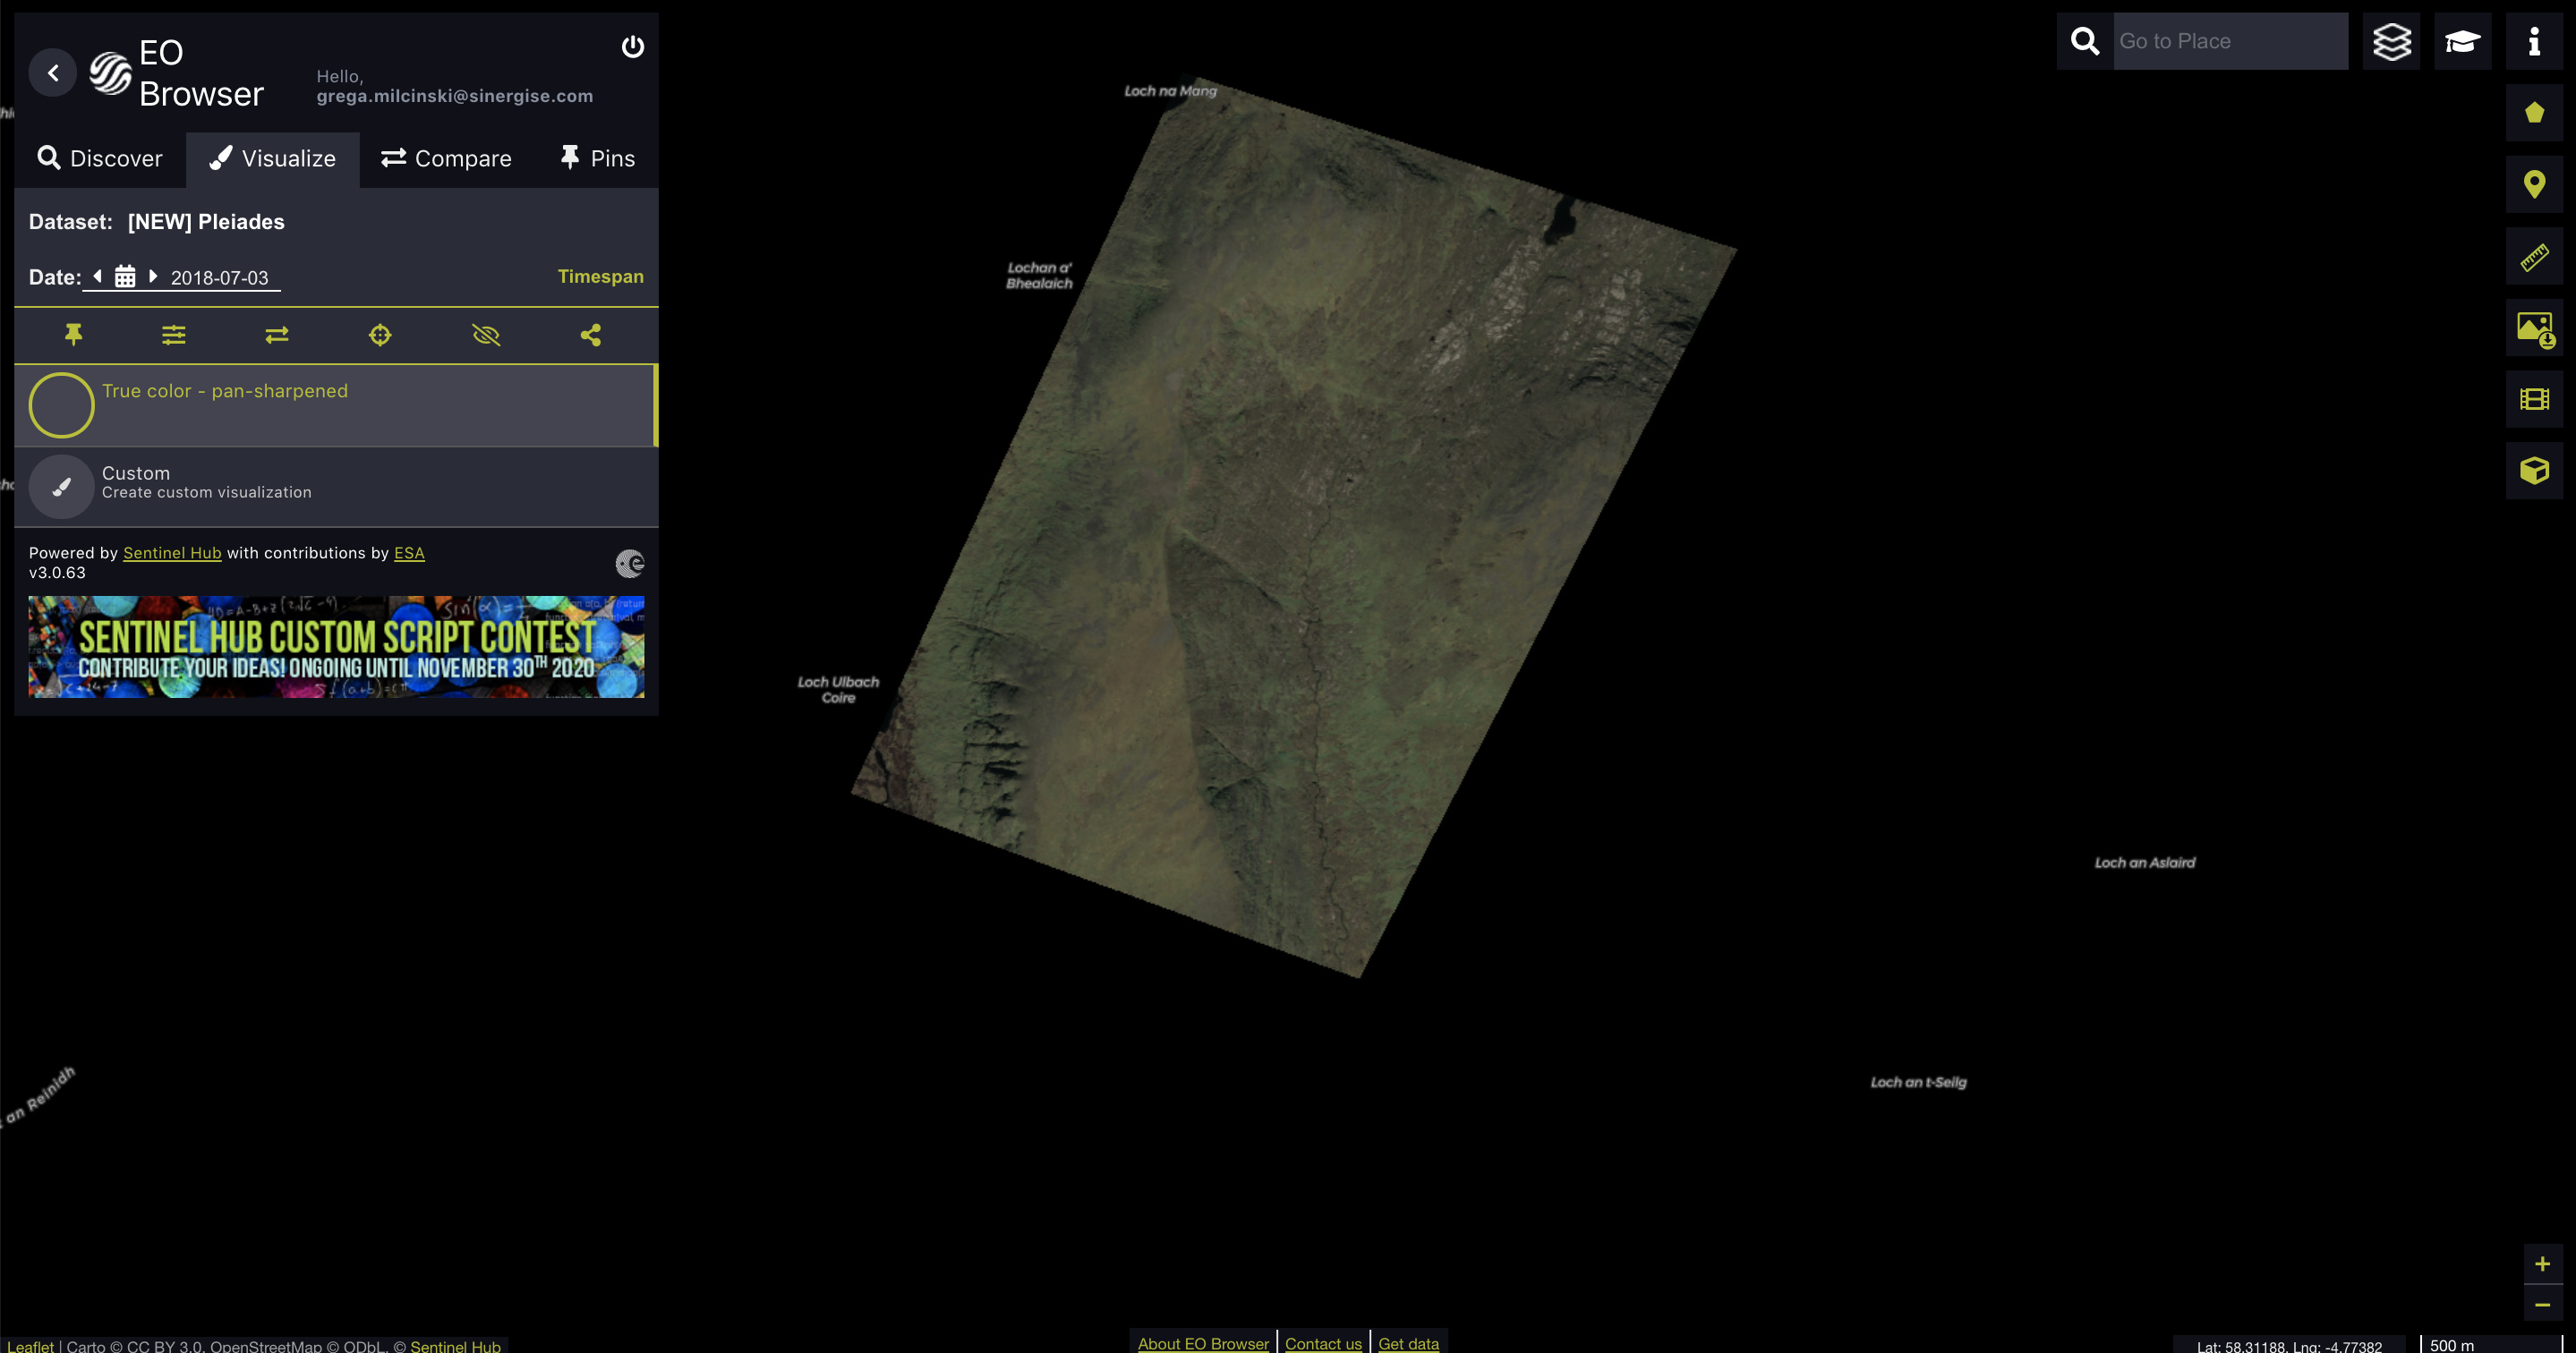
In the “Theme” section select “Pleiades”, then check the Pleiades box below and set the time range appropriately, along the lines you see here:
-
Click Search, then click VIsualise.
-
Enjoy

If you need other areas or dates, you simply repeat the process I described in the previous post, with just one difference. In “Order options” fill in the “Collection id” box, inserting the one that was created for the initial order (32b57c05-0c65-MASKED). You will find full ID here. This step will ensure that the data will be ingested in the same collection as the first image, so you will find them in EO Browser without any additional step required.
Some more comments:
- instead of uploading KML you can manually draw the polygon, using these buttons:
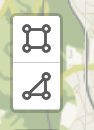
- You can order smaller or larger areas, as long as you have sufficient quota. So yes, it just cost more.
- Do change the “cloud coverage” setting a bit to explore, how it impacts the number of results. In the resutls you will find the cloud coverage information as well (in % of the full scene), so you can decide, whether it is “worth” to order it or not. You can do as many searches as you need right now, without purchasing additional quota. As long as you do not click “Confirm order”, you will not consume anything.
- VHR satellites (0.5 meters) cannot acquire whole world every day, not even every week. This is why satellite providers typically make an observation when there is someone ordering it or if it is good weather or similar. Therefore there is low chance that data will be available just on the right dates.
About the research project - I guess it depends, whether it is actually possible to detect these animals or not. But hey, a group of scientists has discovered penguins using satellite.
Find step by step instruction on how to submit a proposal here:
Grega,
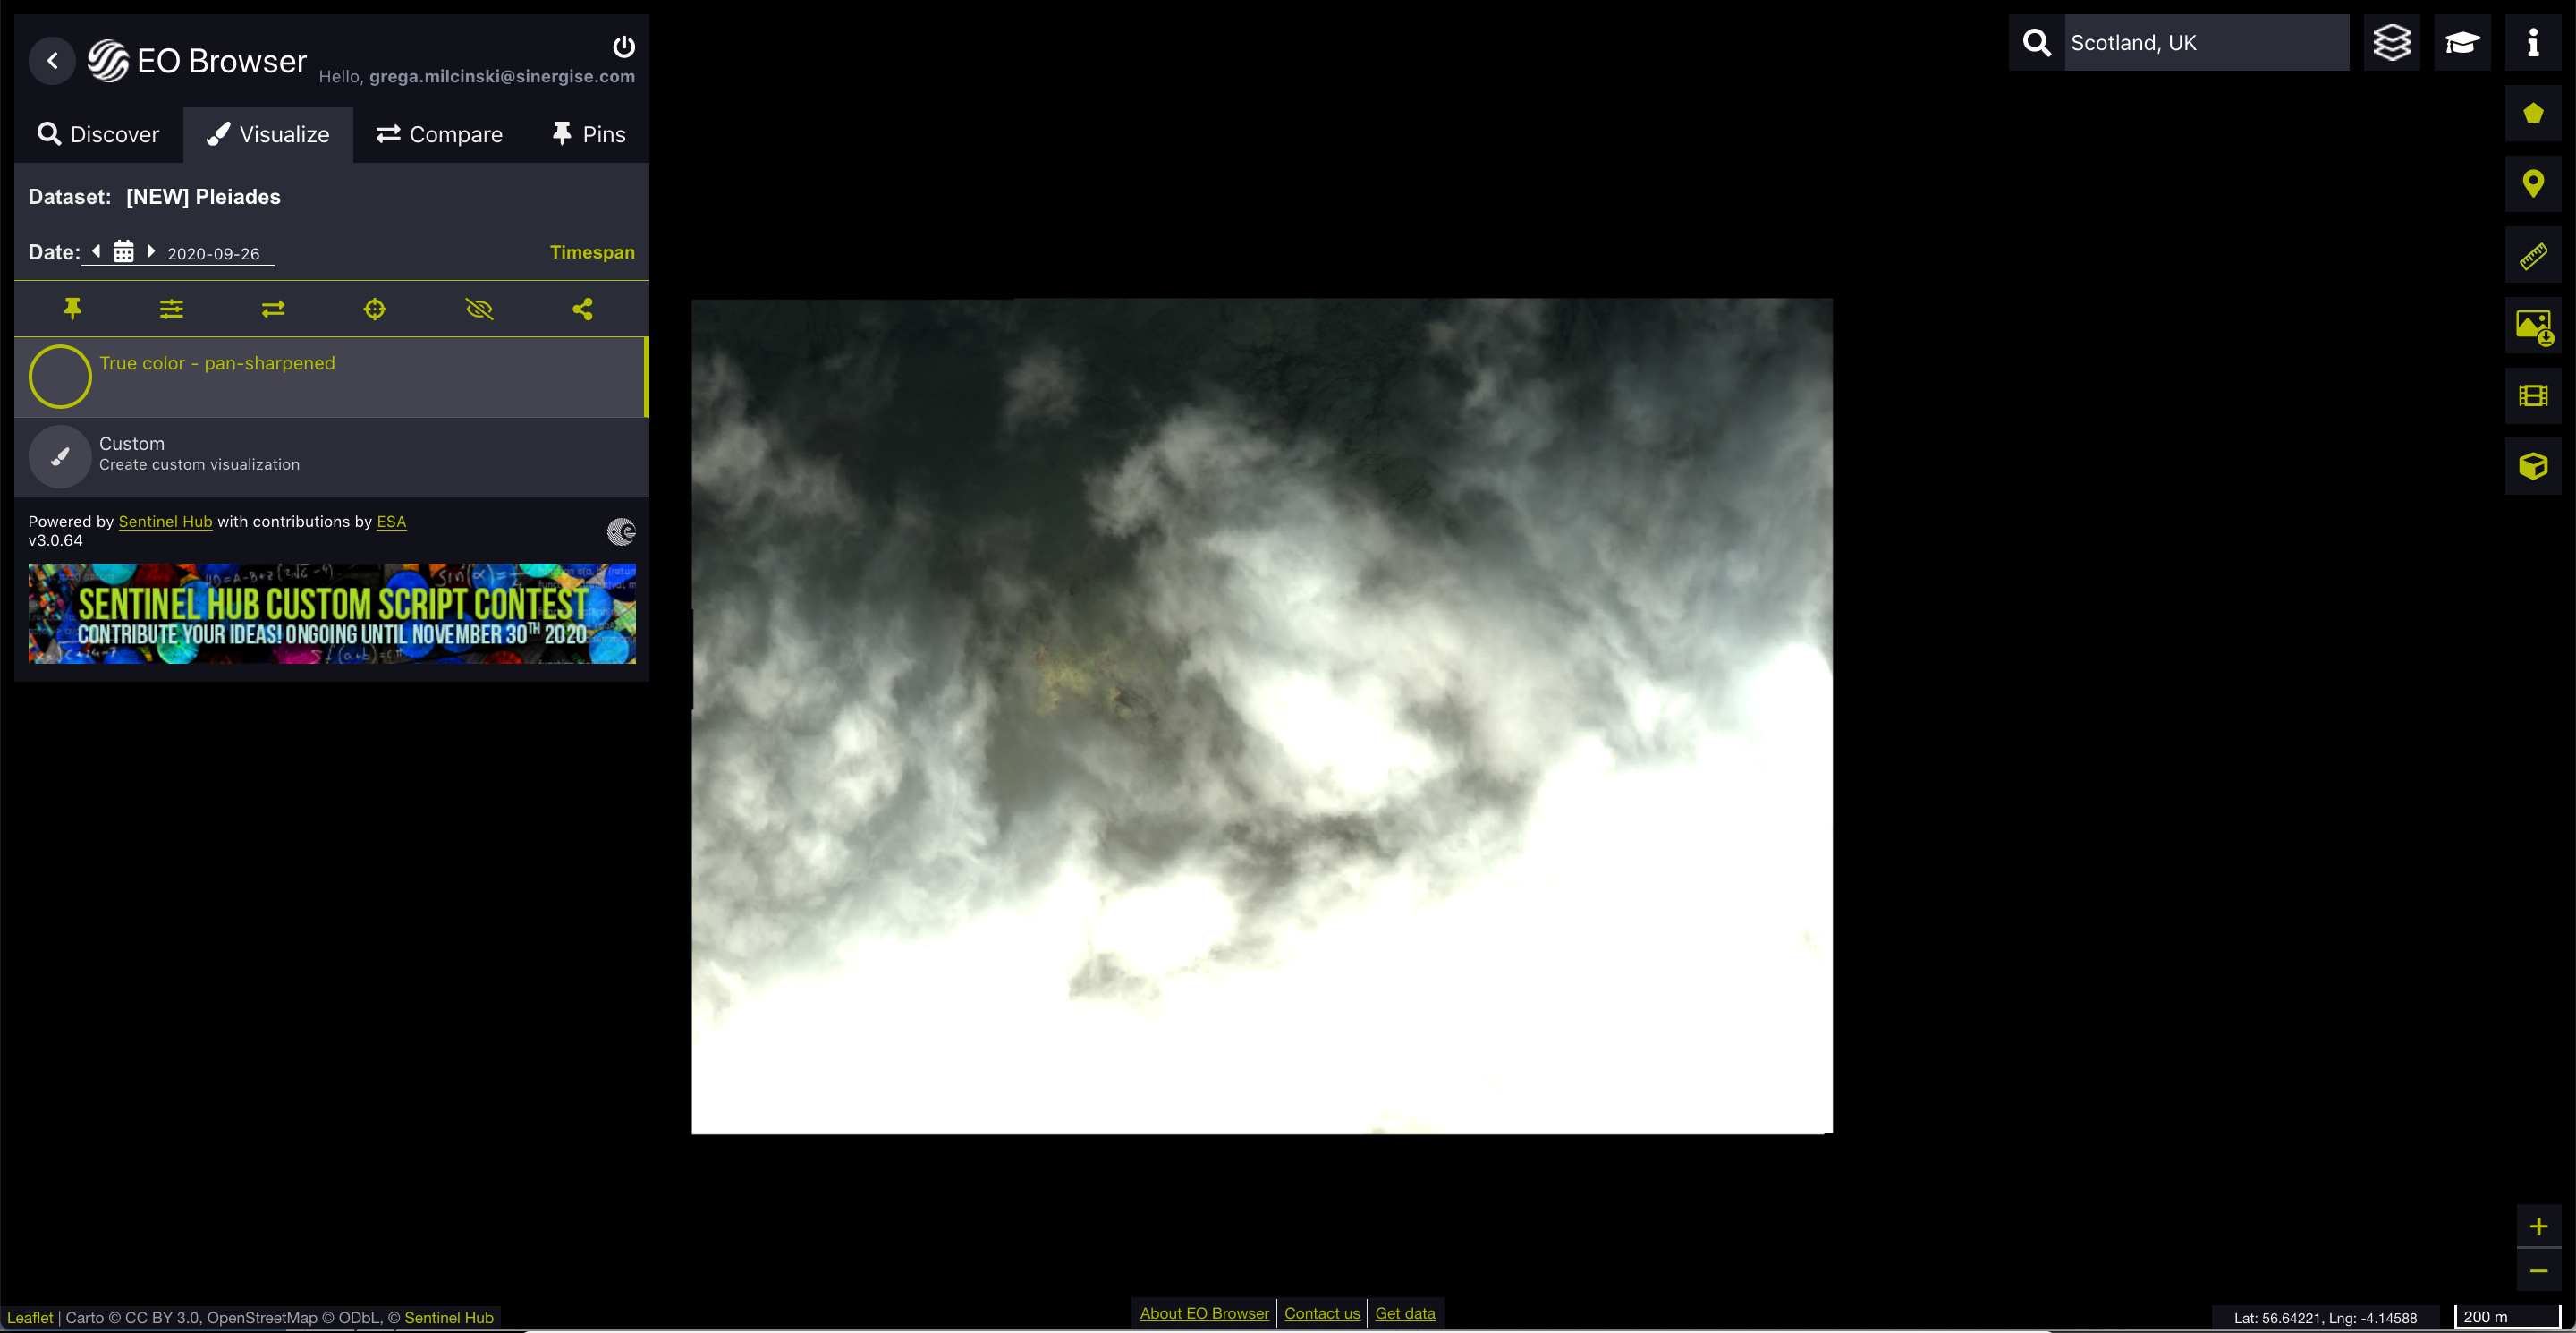
I have managed to get some further data but am unable to vizualize.
Could you maybe assist please.
What seems to be the problem?
You just go to the location of the new image in EO Browser (e.g. here) and search for it. Make sure to set the correct time range when searching (e.g. image is from 2020-09-26).
It’s quite a bit cloudy though ![]()